Mercator's Instructions: The "Organum Directorium"
Mercator's Instructions: The "Organum Directorium"

The Flemish cartographer Gerard Mercator was born 500 years ago this year. His revolutionary Mercator projection was first used in his world map of 1569. In this projection, straight loxodromes (lines of constant course) intersect a grid of perpendicular meridians and parallels.
To make his projection conformal, Mercator used "enlarged latitudes". The exact mathematics of the Mercator projection were not known in Mercator's time. He therefore included a graphical tool, the "Organum Directorium", to estimate the distance between two points on the map.
This Demonstration lets you simulate how navigators had to proceed using the "Organum Directorium" to find both true course and distance covered. The latitude and longitude can be varied using locators. You can see that Mercator's graphical method was reasonably close, except for paths close to or parallel to the equator.
The organum is basically a chart with a linear horizontal longitude axis and a vertical latitude axis that is not linear but has the "enlarged latitudes", which Mercator invented. In this Demonstration, a copy of the "Organum Directorium" from [3] is used as the background. The image was straightened and colored using Mathematica image processing.
Although logarithms were not known in 1569, the accuracy of the organum is good, except for course angles close to 90°. The InverseGudermannian function, needed for an exact calculation, requires too much accuracy close to to make a graphical approach sufficiently precise.
π/2
The procedure to be used was printed on the map in Latin [3]. The mathematics of the procedure are in [4].
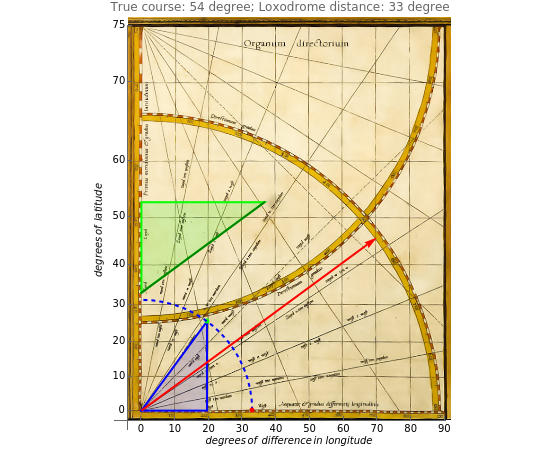
Here is how to proceed to find true course and loxodrome distance between two locations on the world map using the directorium:
1. The first location is defined by latitude only and is set by moving the blue locator to its position on the vertical latitude axis.
2. The second location is set by moving the red locator to its latitude and its longitude difference with the first location.
3. A course line is drawn between the two marked locations. These two locations and the vertical form a right (green) triangle named "enlarged course triangle".
4. A string, here represented by one of two red arrows, is attached [2] to the upper- and lower-left corners of the organum. To read the course angle between the two locations, stretch the appropriate string parallel with the course line and read the angle on one of the scaled arcs. The red arrows do this automatically in this Demonstration.
5. The loxodrome distance is determined by drawing the (blue) "real course triangle". This right triangle has as its horizontal base the latitude difference between the locations and is similar to the enlarged course triangle. The length of the hypotenuse of this triangle, here between the green control point and the origin, is the loxodrome distance in degrees. The exact degrees can be read at the red control point by moving the hypotenuse to the longitude axis by means of the blue dashed arc.