Matching Temperature Data to a Normal Distribution
Matching Temperature Data to a Normal Distribution


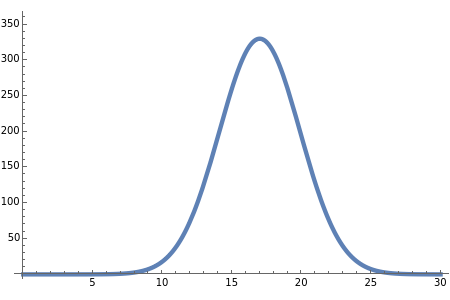
The temperature data for London over the summers from 1976 to 2010 is plotted as a histogram. Choose parameters to match a normal distribution curve to the histogram.