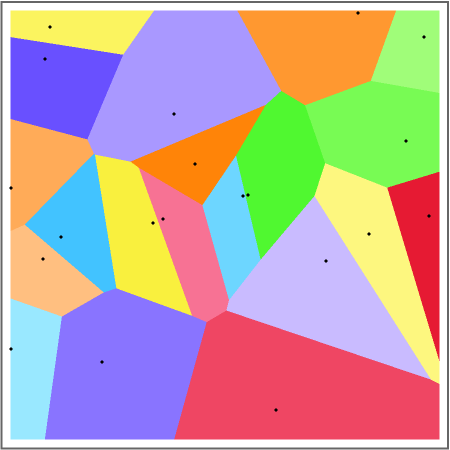
A Voronoi diagram is a tessellation in which each polygon (or "Voronoi cell") represents the set of points closest to a central "seed" point. Voronoi diagrams have a variety of uses in multiple fields including physics, chemistry, mathematics, map generation, and climatology. Lloyd relaxation (also called Voronoi relaxation) redraws these polygons after moving the seed of each cell in a Voronoi diagram to the centroid of that cell. Repeated iteration of this process causes the seeds to space out evenly and settle into a stable state known as a "centroidal Voronoi tessellation". This Demonstration shows the effect of repeated Lloyd relaxation on a randomly generated Voronoi diagram. To step through the iteration, click "append relaxation" several times. Use the "diagram index" control to review the history of the iteration. To start again from scratch, reset with some chosen number of points.