Line Plots, Histograms, and Stem-and-Leaf Plots
Line Plots, Histograms, and Stem-and-Leaf Plots


Here are various ways to display data graphically.
A line plot shows data along a number line with "x"s or other symbols to mark the frequency of data.
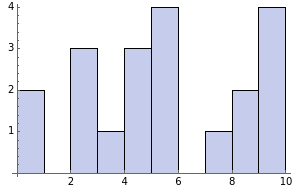
A histogram shows tabulated frequencies of numbers in sets of categories. In this case the categories are the ranges from 0-1, 1-2, ….
Finally, the stem-and-leaf plot shows a stem (the initial digit) as well as all the second digits (the "leaves") for that stem. For example, if 9 | 024 is a line in the stem and leaf plot, the data contains 9.0, 9.2, and 9.4.