Life Transitions
Life Transitions


During the 1990s, Dr. James Robinson, an actuary, combined a careful examination of data and a continuous-time Markov model to develop a mathematical method for estimating the probability distribution of eight possible "health states" in which an individual of specified gender, initial age, and initial health state might be in after a specified period of time. Thus, the method could specify the probability that a healthy 51-year-old male might be in a health state characterized by severe cognitive impairment one month hence.
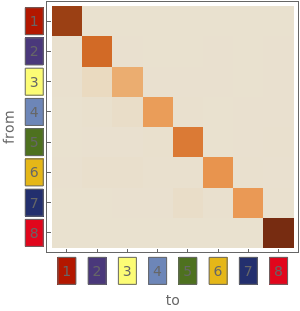
This Demonstration implements and explores this method of predicting the future health of individuals. You specify the gender and initial age of the individual. You likewise specify the length of the transition period, choosing to denominate it in terms of days, weeks, months, or years. In "array view", the Demonstration displays the Markov transition matrix showing the distribution of probabilities for each terminal state for each initial state. Each state is labeled with a number; a tooltip associated with each number further describes the state of health. In "Markov view", the Demonstration directly shows the Markov transition matrix. In "flow view", the Demonstration displays a directed graph showing the transitions with edges thickened in accord with their probability. Advanced controls described in the details section permit you to customize these visualizations.