Kinematics of Traffic Congestion
Kinematics of Traffic Congestion


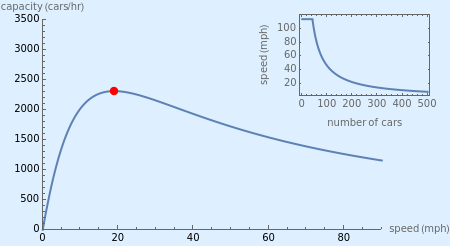
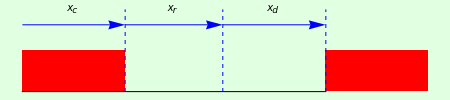
This simple model of traffic congestion on an expressway calculates the optimum speed for a given flow of vehicles. First the model calculates the stopping distance , which is the sum of the length of the car , the distance that the car moves while the driver reacts , and the braking distance based on the deceleration.
L=++
x
c
x
r
x
d
x
c
x
r
x
d
For example, a typical car is 10 feet long and the time to react around 0.5 seconds. Suppose a speed of 55 mph and deceleration of . During the reaction time, the car travels 40.4 feet and needs 181 feet to stop. Then the stopping distance is 231 ft. If the length of the expressway is 10000 ft, then 43 vehicles fit without accidents.
-18ft/
2
s
The plot shows the number of cars per hour as a function of speed, as a function of three factors. The maximum speed and capacity is shown at the red dot (a tooltip gives the values) and the small plot shows the velocity as a function of the number of cars for this value. The picture at the bottom shows the minimal distance between cars.