K-value of Several Hydrocarbons versus Temperature and Pressure
K-value of Several Hydrocarbons versus Temperature and Pressure

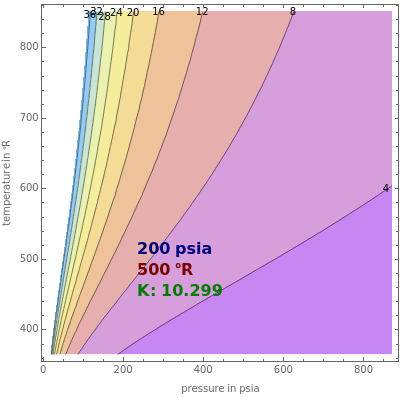
This Demonstration shows the contour plot of = versus temperature expressed in °R and pressure expressed in psia, where and are the mole fractions of component in the liquid and vapor phases, respectively. For many systems, -values are approximately independent of composition and we have (T,p).
K
A
y
A
x
A
x
A
y
A
A
K
K
A
For light hydrocarbons, the approximate -values can be determined from DePriester charts, which have been fit to the following equation: , where the constants , , , , , and are tabulated [1]. Drag or click the locator to display the values of the temperature and pressure as well as the -value for various light hydrocarbons.
K
ln(K)=+++ln(p)++
a
T
1
2
T
a
T
2
T
a
T
6
a
p
1
a
p
2
2
p
a
p
3
p
a
T
1
a
T
2
a
T6
6
a
p
1
a
p
2
a
p
3
K