Histogram Threshold by Max Contour Contrast
Histogram Threshold by Max Contour Contrast


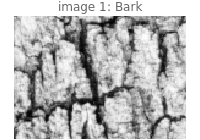

The display shows three ways of thresholding a gray-level image: using an interactive slider (top right), using the max-contour-contrast algorithm (middle right), or using the well-known Otsu min-variance algorithm (bottom right). Both algorithms work by examining image histograms.
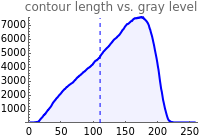
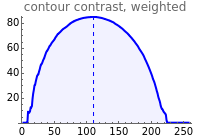
The max-contrast algorithm calculates the average contrast along the boundary for each possible threshold value (center plot) and chooses a threshold at the greatest value (dashed blue line).
The Otsu algorithm sums the variance of the black pixels (less than the threshold) and the white pixels for each threshold value (bottom, center plot), and chooses a threshold at the minimum (dashed purple line).