Graphing Systems of Inequalities
Graphing Systems of Inequalities


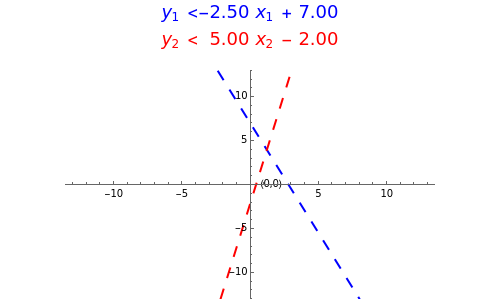
This Demonstration allows you to input a system of inequalities that will be graphed for you. Using a locator you can then choose test points for each inequality and shade on the side of the locator. Mathematica will then check your solution and provide immediate feedback.