Frequentist versus Bayesian PDF for Binary Decisions Like Coin Tossing, OSHA Compliance, and Jury Trials
Frequentist versus Bayesian PDF for Binary Decisions Like Coin Tossing, OSHA Compliance, and Jury Trials


The probability of success in a single trial , the number of trials in an experiment , and the number of successful trials are the parameters used to illustrate both frequentist deductive reasoning and Bayesian inductive reasoning. The trials are independent and identically distributed (iid).
p
n
s
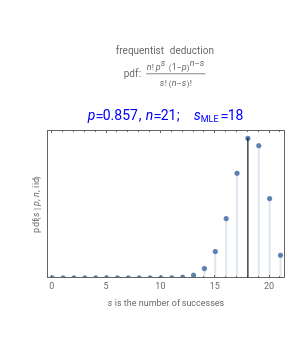
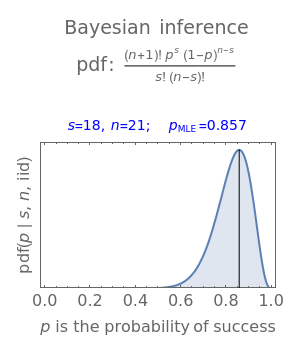
A frequentist uses parameters of a probability density function (PDF) to deduce the probability of observable data, as in the left panel. A Bayesian uses observed data to infer the parameters of a PDF, as in the right panel.
The data from an experiment involving trials has successes and failures. The black vertical lines mark the maximum likelihood estimate (MLE) values for each PDF.
n
s
n-s
The frequentist assumes parameters of the sampled population are known and estimates the probability of observable data in the experiment. The dark vertical line in the left panel marks , the most likely number of successes in future trials, assuming that the probability of success in any trial is equal to the observed fraction of successes.
s
MLE
n
The Bayesian assumes the data is known and finds the MLE value and the probability density function of parameters from a plausible parent distribution. The vertical line in the right panel marks , the maximum value of the continuous probability distribution posited for the parameter when successes are observed in trials.
p
MLE
p
s
n
The notation used to label the axes is common in Bayesian inference textbooks: means the probability density function for the parameter , given observations and assumptions on the right of "|". Using the right panel to illustrate, read the label as: "the probability density function for given a numerical value for , a numerical value for , and that the iid conditions are true".
y
pdf(P|C)
P
p
s
n