Forming the Efficient Frontier When Returns Are Non-Normal
Forming the Efficient Frontier When Returns Are Non-Normal

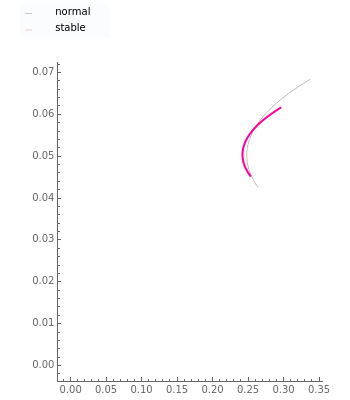
The finance paradigm since Markowitz (1952) depends heavily on the assumption that asset returns are normally distributed. If one believes that asset returns have a Lévy stable distribution or some mixture of normal and stable that exhibits heavy tails, one wonders how the so-called efficient frontier is affected. Despite the fact that, in the limit, variance does not exist for the non-normal stable distribution, one can always calculate the variance for a finite sample. This Demonstration shows how wildly erratic such a misguided effort can be. The approach is to draw three samples of stable random variates, beginning with a non-normal random draw and setting the same stable parameters {, , , } for each within reasonably narrow bounds (to prevent the graphic from becoming too large or the axes scales becoming too small). From those samples we create the "frontier" using the conventional technology. We then take the mean and variance of the same stable sample and construct the frontier as if the sample was distributed normally and plot its "frontier". This latter, while apparently a useless exercise, is in fact what is being done by risk managers who constrain their calculations to assume normality when in fact the data are not normal. Which is the "efficient" frontier? Repeated trials show a wide variety of "frontiers" in which the normal and stable switch order, first one and then the other appearing to the left (less risky) and size (at times one or the other may appear as small as a single point). Clearly, not much can be learned about efficient asset allocation to minimize risk under these circumstances.
α
β
γ
δ
One reason for this is found in the "Why?" tab. When , the stable distribution is normal and a plot of the standard deviation of 100 samples, each of size 1000, shows a wide dispersion of the standard deviations. But, using any , clear the "normal" checkbox and you see a clustering of standard deviations. This clustering is typical of risk frameworks characterized by distributions having extreme values or heavy tails. Thus, we learn that the normal assumption misstates the risk in such cases.
α=2
α<2
This Demonstration shows how important the assumption of normality is to the dominant finance paradigm.