Filling a Container Defined by a Curve
Filling a Container Defined by a Curve


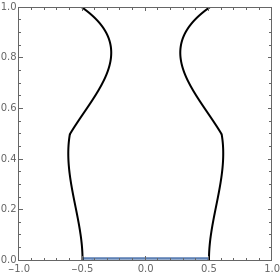

The graphic on the left shows the profile of a circularly symmetric container centered on the vertical axis. Its shape is controlled by moving the locators and selecting either a curved profile or linear segments joining the locators. As you move the slider, the height of the fluid changes. The graph on the right shows either fluid height as a function of volume or fluid volume as a function of height.