Failure Probabilities from Quality Control Charts
Failure Probabilities from Quality Control Charts


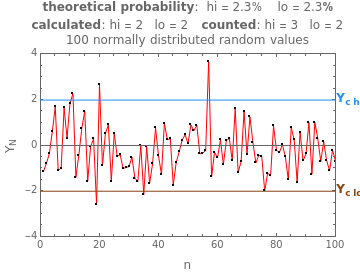
This Demonstration aids in the visualization of how the probability of exceeding a selected tolerance level can be estimated from an irregular time series of the kind frequently encountered in industrial quality control charts. The estimation method assumes that the records consist of independent random entries that are normally or lognormally distributed. The method also translates the series's mean and standard deviation into frequencies of events that are outside the permitted range.