Estimating the Time between Mishaps from Quality Control Data
Estimating the Time between Mishaps from Quality Control Data


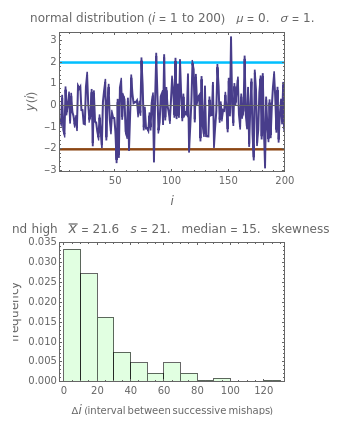
The random entries in the quality control charts of a stable process usually have a normal distribution. This implies that there is a probability that an entry or count exceeds or falls below some threshold level (an event we call a mishap). The mishap's frequency is determined by the normal distribution's parameters and the thresholds. This Demonstration simulates such charts, records the occurrences of mishaps, determines the time intervals between them, and plots their histogram. These statistics can serve as a tool in risk assessment. The histograms of the times to either exceed the upper threshold or fall below the lower one are special cases that can also be examined in the Demonstration.