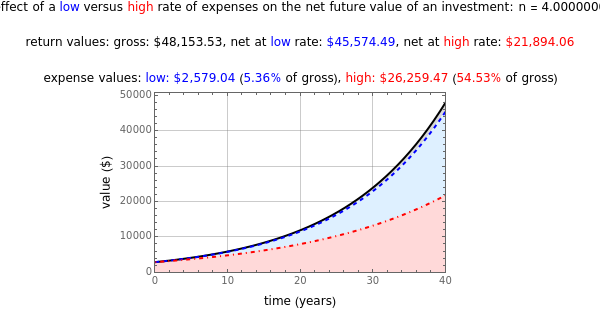
The net yield of a long-term investment primarily depends on an effective interest return rate and the way in which it is compounded. However, the actual yield also heavily depends on the total expense rate charged to maintain the account, which typically ranges from a fraction of a percent to a few percent. The expense rate can have a huge accumulated effect as time goes on. This Demonstration generates and plots investment value versus time curves at various effective return rates. Both the low and high expense rates, with various effective compounding frequencies, are shown in scenarios where regular fixed contributions may be added periodically to the original investment amount. The difference between the gross and net yields at both low and high expense rates is calculated and tables are generated that show the yield after different combinations of holding times, return rates and expense rates.