Dynamics in the Solow-Swan Growth Model
Dynamics in the Solow-Swan Growth Model


The Solow–Swan model is a simple neoclassical growth model. It postulates that growth of per-capita output is the result of capital accumulation and/or technological progress. As soon as the economy reaches its steady state, per-capita output growth is only possible via technological progress, which is exogenous in the model.
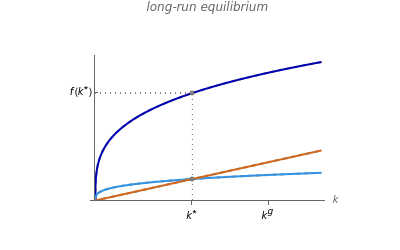
It is convenient to represent all aggregate variables in quantities per effective labor (i.e., labor augmented by the technology level) because the steady-state capital per effective labor is constant. As shown with "long run equilibrium", this steady-state level is determined by the intersection of the savings and the break-even investment curves, and , respectively. Furthermore, the golden rule capital is the level of capital for which consumption is maximized.
*
k
sf(k)
(n+δ+g)k
g
k
If any model parameters are changed by exogenous shocks at time , a new equilibrium ensues and can be compared to the baseline scenario (denoted by the subscript ) associated with the original parameter values. In addition to this comparative static analysis, the five other graphs show the model dynamics illustrating the adjustment process that leads to the new equilibrium.
t
s
b