Dynamic Model of Pandemic Influenza with Age Structure and Vaccination
Dynamic Model of Pandemic Influenza with Age Structure and Vaccination


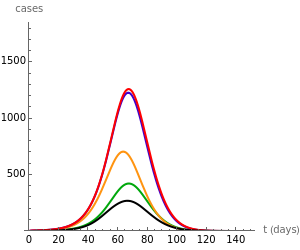

This Demonstration presents a 50-dimensional nonautonomous compartmental SEIR-based model with age structure to study the effect of age-specific scheduling of vaccination during a pandemic influenza outbreak, specifically when there is a race between the vaccination campaign and the dynamics of the pandemic. (SEIR stands for Susceptible, Exposed (but not infectious), Infectious, and Recovered.) We compare four different scheduling strategies and target a 60% vaccination coverage in each age group using all of the strategies. You can use the "days elapsed" slider to follow the vaccination order of the age groups and the vaccination state on the bar chart. The morbidity curves of the five age groups (the total population size is 100,000) are depicted on the left chart and change as you modify the epidemiological parameters. The attack rate (AR) of an age group is the fraction of the age group that contracts the infection during the course of the outbreak. The reproduction number is the key concept of an epidemic, as it determines the average number of infections generated by a single infected individual introduced into a wholly susceptible population.