Distribution of the Means of Samples Having Random Sizes
Distribution of the Means of Samples Having Random Sizes


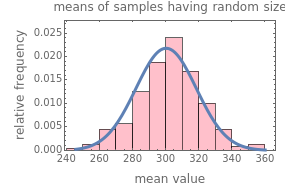

This Demonstration generates a specified number of random samples of real numbers or integers taken from a population having uniform distribution within a chosen range; the sample sizes are also chosen at random from a uniform distribution with specified range. The Demonstration calculates the means of the samples and plots their histogram with a superimposed normal (Gaussian) probability density function having its mean and standard deviation equal to the mean and standard deviation of the means of the random samples.
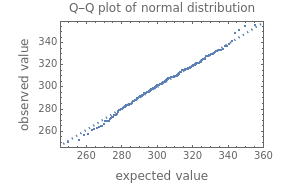
For comparison, it also calculates analytically and displays the mean and standard deviation of the distribution of sample means had the samples been of uniform size equal to the mean of the sample size distribution. The Demonstration also displays the corresponding Q-Q plot of the sample means and shows that when the random sample sizes are sufficiently large and not too dispersed, the distribution of the sample means becomes approximately normal, as could be anticipated from the theorems of Robbins and Billingsley.