Distribution of Colloidal Particles during Solvent Evaporation
Distribution of Colloidal Particles during Solvent Evaporation


This Demonstration examines the underlying processes that take place when a colloidal dispersion of uniform thickness consolidates as solvent is removed. The overlying gas phase is assumed to be unsaturated with vapor, thereby providing the driving force for solvent evaporation to take place. The evaporation rate can be expressed as =(-), where is an appropriate mass transfer coefficient and and are the vapor pressures at the interface and in the bulk air, respectively. As the solvent evaporates (), the film thins and particles begin to consolidate at the gas–liquid interface . The distribution of particles at any instant in time is denoted by .
H
0
E
k
m
p
i
p
∞
k
m
p
i
p
∞
t>0
h(t)=-t
H
0
E
ϕ(y,t)
The vertical distribution of particles in the uniformly consolidating film is controlled by the Péclet number , where =6πμ/kT is the Stokes–Einstein diffusion coefficient for the colloidal particles. For , diffusion of particles relative to convection of particles is strong, and an almost uniform particle distribution during drying is therefore expected (see Snapshot 1). On the other hand, for , we expect to see a skin-like formation with a random close packing of particles having a volume fraction =0.64 in the neighborhood of the advancing interface (see Snapshot 2).
e=
H
0
E
0
0
R
0
e≪1
e>1
ϕ
max
To solve this problem, it is convenient to transform the moving domain to a fixed domain by introducing the dimensionless variables and .
0≤y≤h(t)
ξ=y-t
H
0
E
τ=t
The species balance for volume fraction becomes:
ϕ
∂ϕ
∂τ
ξ
(1-τ)
∂ϕ
∂ξ
1
e
2
(1-τ)
∂
∂ξ
ϕ
∂ϕ
∂ξ
subject to the following boundary conditions:
∂ϕ
∂ξ
ξ=0
K(ϕ)[ϕZ(ϕ)]=e(1-τ)ϕ
ϕ
∂ϕ
∂ξ
ξ=1
We solve the partial differential equation using the spectral collocation method with the number of collocation points =31.
N
p
Use the sliders to vary the initial volume fraction , the Péclet number and the evaporation time .
ϕ
0
e
t
vap
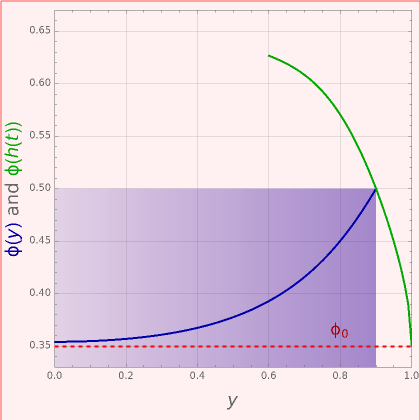
The green curve shows the evolution of the interface volume fraction, in the drying film for . At , this value is equal to (shown by the dotted red horizontal line). At , this curve intersects the blue curve (i.e. the curve representing the particle density profile expressed in terms of the volume fraction or versus ) at a point marked in cyan. During drying (i.e. increased values of ), the volume fraction increases as the solvent evaporates and decreases. For and near the interface, approaches its limiting value, =0.64, as is evident from Snapshot 2.
ϕ(h(t),t)
0≤t≤0.4
t=0
ϕ
0
t=
t
vap
ϕ(y,)
t
vap
y
t
vap
h(t)
t=0.4
ϕ
ϕ
max