Digital Representation of a Nonlinear ODE with Small Differences in Initial Conditions
Digital Representation of a Nonlinear ODE with Small Differences in Initial Conditions


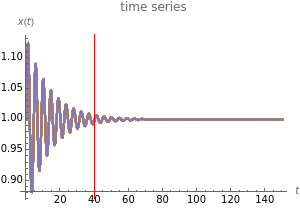
The graphic on the left overlays the plots of the solutions of a nonlinear ODE with 50 slightly different initial conditions.
x(t)
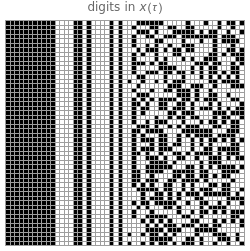
The graphic on the right shows the digits of in base 2 for each of those solutions at . (The line is shown in red on the left.) Each row represents one of the 50 solutions.
x(τ)
x=τ
x=τ
Thus this Demonstration shows the change in the digital representation of the solutions to that set of nonlinear ODEs at a point as the ODE changes from periodic to chaotic with increasing .
τ
a