Digit Frequencies in the Columns of Cellular Automata
Digit Frequencies in the Columns of Cellular Automata


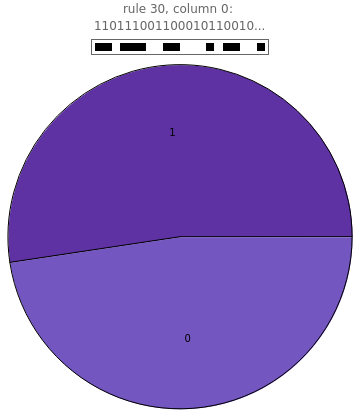
This Demonstration shows a pie chart that accumulates the digits in a vertical column of a given elementary cellular automaton. The slices cut the pie chart into parts, indicating the statistical frequency of ones and zeros in the column. For instance, you can see that most columns for rule 30 seem to be statistically random. An interesting case is rule 110, which does not look statistically random even when the number of steps is large; its columns alternate between having more black cells (ones) and having more white cells (zeros), but they are never in equilibrium.