Density of the Kou Jump Diffusion Process
Density of the Kou Jump Diffusion Process


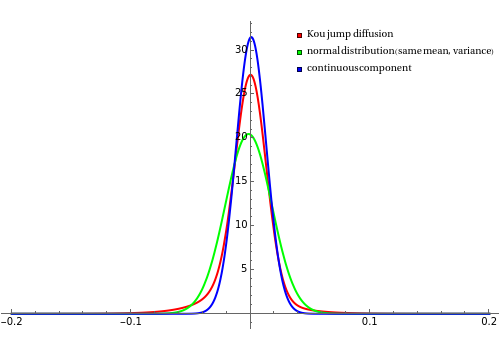
This Demonstration shows a graph of an approximate probability density function of the returns of the Kou jump diffusion process (red) together with the graphs of two closely related normal densities. The blue graph shows the density of the continuous component of the jump diffusion process. The green graph shows the density of the normal distribution with the same mean and standard deviation as the jump diffusion. When the jump intensity parameter is set to 0, all three curves coincide.