Cumulative Sums and Visual Change Detection between Two Random Processes
Cumulative Sums and Visual Change Detection between Two Random Processes


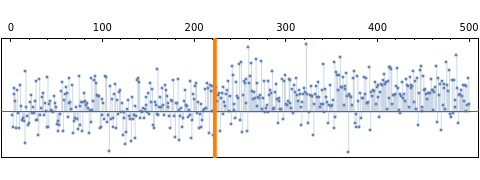
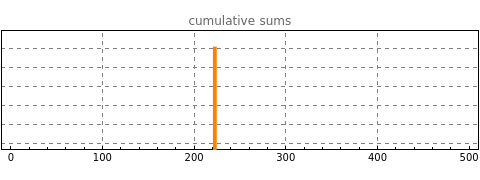
This Demonstration illustrates a simplified version of the method of cumulative sums (CUSUM). A dataset of the form , , …, is constructed by drawing the first observations at random from a normal distribution with mean specified by the "left process" control and the remainder from a normal distribution with mean specified by the "right process" control. The standard deviation in both cases is 3. The top graph shows the dataset, while the bottom graph shows the cumulative sums of the dataset (i.e., the values , , …, where =). It is arguably easier to detect the boundary between the two processes from the second plot than from the first.
x
1
x
2
x
500
n
s
1
s
2
s
n
s
k
k
∑
i=1
x
i