Cumulative Distribution and Residence Time Distribution Curves
Cumulative Distribution and Residence Time Distribution Curves


Consider the following mixture distribution:
f(x)=++
1
5
2π
-2
2
x
e
1
σ
1
-2
2
(x-)
μ
1
2
σ
1
e
3
σ
2
-2
2
(x-)
μ
2
2
σ
2
e
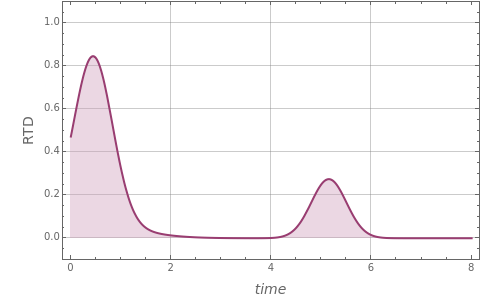
You can change this distribution's properties by setting values for , , , and . This Demonstration plots this distribution. For specific values of , , , and , one can obtain a bimodal distribution, which mimics the residence time distribution () of a batch reactor.
μ
1
μ
2
σ
1
σ
2
μ
1
μ
2
σ
1
σ
2
RTD
This Demonstration also computes the cumulative distribution curve, , which as expected exhibits two plateaus in the case of a bimodal . The cumulative distribution is given by the following definition: , where is the residence time distribution.
F(x)
RTD
1-F(x)=E(u)du
∞
∫
x
E(u)