Correlation and Covariance of Random Discrete Signals
Correlation and Covariance of Random Discrete Signals
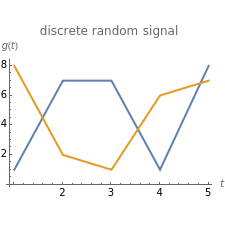
Correlation and covariance can be used to analyze the relationship between signals. They can give information on the characteristics of a system and how it behaves.
The expected value of a random variable is given by and estimated by , the average of a sampling of values of . The standard deviation of is given by =and estimated by the sample standard deviation of .
Z
E[Z]
z
{,,…,}
z
1
z
2
z
n
Z
Z
σ
z
E
2
(Z-E[Z])
{,,…,}
z
1
z
2
z
n
The covariance is a measure of the deviation between two sets of random variables.
σ
xy
The correlation is the degree to which two sets of random variables depend upon each other.
ρ
Sample estimates of standard deviations, covariances, and correlations are denoted with hats (^).
