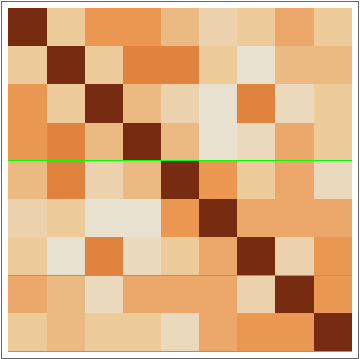
You choose the number of factors the "judges" collectively take into account in determining how to decide a case. You choose the number of "judges" on the "court". These parameters generate a set of random and uncorrelated rules. You then correlate the rules by choosing (a) the number of clusters into which the judges fall, (b) the degree of correlation of rules within each cluster, and (c) the method by which correlation is to occur. When the "mean" method is selected, the system responds by moving the decision rules within the clusters toward the mean decision rule within that cluster. When the "leader" method is selected, the system responds by moving the decision rules within the clusters toward the first decision rule within that cluster. You can then visualize the results in one of three ways. With the "distance matrix" view, you see the Hamming distance between all of the judges. Green dividers show the clustering of the judges. With the "binary rules" view, you see arrays of the raw decision rules themselves, with green dividers again delineating the different clusters. With the "decision tree" view, you can use the advanced controls to see visualizations of the decision trees of each of the judges.