Continuity of a Complex Function
Continuity of a Complex Function


Let be a complex function where and are open subsets in . The function is continuous at the point if for every there is a such that for all points that satisfy the inequality , the inequality holds.
f:EF
E
F
f(z)
z
0
ϵ>0
δ>0
z∈E
|z-|<δ
z
0
f(z)-f()<ϵ
z
0
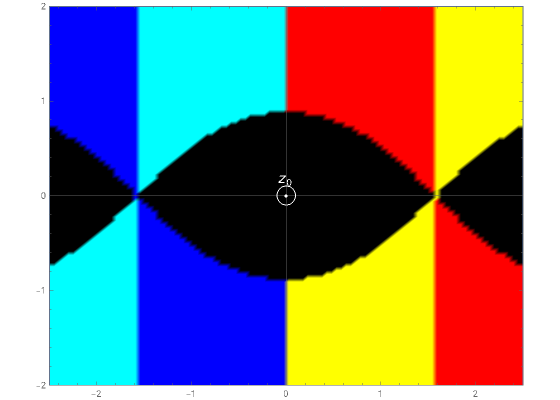
We assign a color to each point of the complex plane as a function of , namely the RGB color of four arguments , , , and (red, green, blue, and opacity). If (with chosen by the slider), we use black. Otherwise, if , ; if , ; if , .
z
w=f(z)-f()
z
0
r
g
b
o
|w|<ϵ
ϵ
Re(w)>0
r=1
Im(w)Re(w)<0
g=1
Re(w)<0
b=1
A black patch around the point means that the function has . After that, we find a such that the circle is inside the patch. Note the branch cut for along the negative real axis.
z
0
w<ϵ
δ
z-<δ
z
0
z