Comparing Parametrizations
Comparing Parametrizations


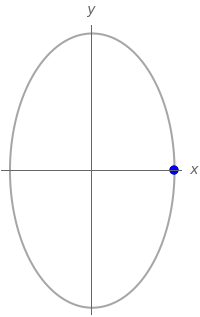

Visualize the behavior of various functions and their relative rates around a track. The track has parametric equations and . Each function in the list replaces the parameter with the new function of . Click the play button to watch how each function traces out the ellipse. The graph on the right shows the functions and illustrates the locations of the points for each value of . The first function, , provides a baseline comparison as goes from to .
x=3cos(t)
y=5sin(t)
t
t
t
t
t
0
2π