Comparing Normal and Student's t-Distributions
Comparing Normal and Student's t-Distributions


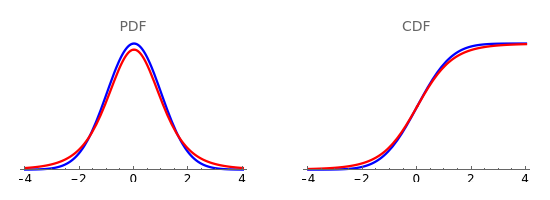
The standard normal distribution (blue) with mean 0 and standard deviation 1 and Student's -distribution (red) become very similar as the degrees of freedom for the -distribution increase. The left panel displays the two probability density functions (PDFs) and the right panel displays the two cumulative distribution functions (CDFs).
t
t