Circumnavigating the Critical Point
Circumnavigating the Critical Point

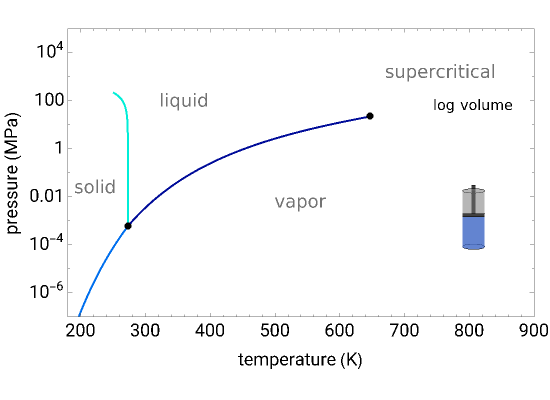
The pressure-temperature phase diagram for water is used to illustrate the concept of state functions and the possibility of going from the liquid phase to the vapor phase (or the other way) without a phase change (a single phase throughout the process) by circumnavigating the critical point, which is the highest temperature and pressure where two distinct phases exist (647 K, 22.1 MPa for water).
The piston and cylinder represent the log of the volume, so that the large differences in volume between gas and liquid can be visualized. Fluid with higher density is shown darker.
The liquid, vapor, and supercritical regions are labeled, but no definite boundaries between these regions exist, because the transitions are continuous when going around the critical point; however, a phase change is observed when crossing the phase boundary.
You can drag the green dot on the plot to change pressure and temperature; the volume (obtained from the Peng–Robinson equation of state) is displayed. The dot can only be moved from to MPa and from the triple point to 720 K so that the volume changes can be more easily displayed.
-3
10
3
10