Cellular Automaton Difference Pattern and Distribution
Cellular Automaton Difference Pattern and Distribution


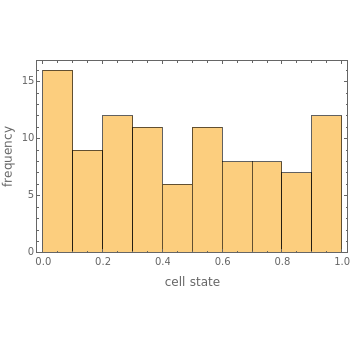
The rule used to generate this cellular automaton subtracts the product of the two adjacent cells from the center cell and then takes it mod 1. This Demonstration shows the difference pattern emerging from a change in the center cell in the top row. To illustrate the difference pattern, use the sliders to adjust both the number of rows and the value of the center cell in the top row. The "reset" button constructs a pseudorandom list of values to replace the first row of the automaton. Click the "histogram" button to show a histogram of the occurrence of color values (binned in tenths), giving a visual representation of this distribution.