Beat Frequency of Sound Waves
Beat Frequency of Sound Waves


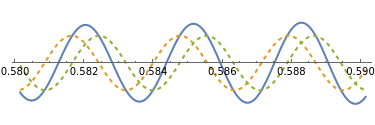

Adjust the sliders to explore the relationship between the difference in frequencies of the two component waveforms (shown dashed) and the resulting beat frequency seen in the upper plot. The red region in the upper plot is projected in the lower plot: move the "zoomed view" slider to view where the component waveforms are in phase, so that their sum reaches maximum amplitude, and where the waveforms are out of phase, so that their sum reaches minimum amplitude. The frequencies permitted by the "mean frequency" slider are audible to humans: click the "play tones" button to hear the resulting beating effect.