Age Distribution in the World
Age Distribution in the World

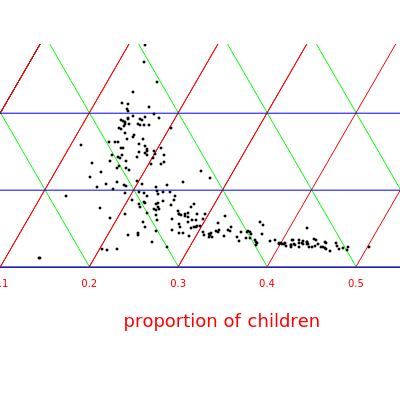
A ternary diagram is a graph that shows the proportion of three variables as a position in an equilateral triangle. The three variables have a constant sum (in this case to unity). This particular diagram shows the population proportion of children (), adults (), and elderly () for different countries. The proportions have been color-coded to facilitate interpretation. This Demonstration uses Mathematica's geographical data to calculate the proportions and for the flags. You can choose a continent or the whole world. Countries with missing data are omitted.
0≤age<15
15≤age<65
65≤age