Create Your Own Photo Filter
Students will learn about color space by making their own filtered images and sharing them online for their friends to see.
Appropriate for ages 11+.
Allow 90 minutes to complete the module.
Important note: This module should be led by an instructor with basic Wolfram Language knowledge. If you would like to learn the language, please try this free online introduction. If you would like a Computational Thinking Initiative ambassador or volunteer to help you run an adventure, please contact us.
Learning Objective
◼
Students will be able to alter the appearance of images by creatively adjusting RGB channel values
Computational Thinking Principles and Practices
◼
Interpreting a problem or idea in a such a way that a computer can assist with it
◼
Exploring entire categories all at once (i.e. look at all flags, all of Shakespeare’s sonnets, etc.)
◼
Simulating things that are hard or impossible to do by performing real-world experiments
Standards Alignment
◼
AP Computer Science Principles:
◼
LO 1.3.1: use computing tools and techniques for creative expression
◼
EK 1.3.1 C: digital images can be created by generating pixel patterns, manipulating existing digital images or combining images
◼
EK 3.1.1 A: computers are used in an iterative and interactive way when processing digital information to gain insight and knowledge
Helpful Background
◼
Information on color space: https://en.wikipedia.org/wiki/Color_space
◼
Wolfram Programming Lab Exploration on colors: http://www.wolfram.com/programming-lab/explorations/make-colors
◼
An Elementary Introduction to the Wolfram Language: http://www.wolfram.com/language/elementary-introduction/07-colors-and-styles.html
STARTING POINT
STARTING POINT
“Today we’re going to be working with colors and images to make our own photo filters. Let’s start by making a color. You can simply type the name of any common color and press + .”
In[1]:=
Purple
Out[1]=
Have students try other colors.
◼ What is your favorite color?
◼ Try more common colors.
CHECKPOINT
Check that every student has made a basic color.
“We can actually combine colors directly to get new colors too. It’s like mixing paint, so we call it Blend.”
In[2]:=
Blend[{Blue,Red}]
Out[2]=
“The computer treats each color as a mixture of three basic colors: red, green and blue. We can look behind the scenes to see what is happening using FullForm.”
In[3]:=
FullForm[Blue]
Out[3]//FullForm=
RGBColor[0,0,1]
“This is really powerful because now we can make new colors with RGBColor just by changing the values. This means we can get really specific colors.”
◼ Try changing the numbers and seeing what happens.
◼ If students try to use RGB values larger than 1, point out that they can use either decimals or fractions, but the numbers have to be between 0 and 1.
◼ Try blending two colors you’ve made. Do the colors make the combination you would expect?
◼ Some students may have tick marks in their RGB colors. This means that the decimal was rounded.
◼ Try using Table to show many colors in a series: Table[RGBColor[0,0,b],{b,0,1,0.1}].
◼ Advanced students may be interested in other color spaces. Investigate CMYK.
◼ Students may want to discuss the reasons that computers use green as a primary color instead of yellow.
CHECKPOINT
Check that students have made a few individual colors.
“If we’re looking for a specific color, it might take us a long time to find it by making one color at a time. The nice thing about using a computer is that we can look at a whole group of similar colors by adding a little bit more of one color. Let’s try it with blue.”
In[4]:=
Table[RGBColor[0,0,b],{b,0,1,0.1}]
Out[4]=
,,,,,,,,,,
“We used a new function here called Table. Table just counts b from 0 to 1 in steps of 0.1, and it makes a new color each time. We can do the same thing again, this time starting with red and adding a little more green each time.”
In[5]:=
Table[RGBColor[1,g,0],{g,0,1,0.05}]
Out[5]=
,,,,,,,,,,,,,,,,,,,,
“Red and green make yellow! Who knew?”
◼ Try playing with Table and RGBColor to make different groups of colors. For example, Table[RGBColor[0, g, .5], {g, 1, 0, -0.05}].
◼ Note that you can mouse over a color icon to see the RGB value. That is useful in case you want to use it later.
CHECKPOINT
Check to see if students understand how Table works.
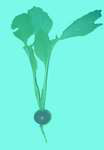
“Images are made of small points of color called pixels. We can change the appearance of the whole image by changing the color of each pixel. Blend lets us do that really quickly.”
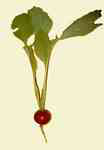
“We can get a picture of a radish by holding + = and typing ‘image of radish’.”
In[6]:=
Out[6]=
Explain that students only need to move their cursor outside of the query box for it to change to the view below. They may hit the checkbox if the suggested code looks correct to them and then run that cell to be sure.
In[7]:=
Out[7]=
In[8]:=
Blend,RGBColor[0,1,1]
Out[8]=
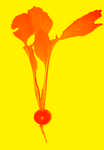
“Blend makes the same change to every pixel. But what if we want to blend different colors into different pixels? We can do this if we have a set of colors to use. Luckily, we just made that using Table !”
In[9]:=
Colorize,ColorFunction(Blend[Table[RGBColor[1,g,0],{g,0,1,0.05}],#]&)
Out[9]=
◼ Demonstrate how to name an image as a variable so that you can use it later: mypicture = + = picture of a radish.
◼ Explain other ways to get pictures such as cutting and pasting, CurrentImage and Import.
◼ If students want to color one image like another image, have them collect the desired color scheme using DominantColors and use that in place of the Table of RGB colors.
◼ Suggest that the students try to recolor the image as itself. What happens? Work with them to figure out what Colorize is doing. (Hint: it involves gray levels.)
◼ A more advanced technique of recoloring an image to match another image requires sorting the DominantColors by GrayLevel.
CHECKPOINT
Check to see if students have created color-tinted versions of their images.
“If we want to visualize how we changed our pictures, we can look for the DominantColors.”
You may need to explain what a “cell” is. Use the brackets on the right side of the notebook to help students see where cells separate, and mention that cells can come in many formats (e.g. input, text, etc.).
◼ How do the DominantColors of your original image compare to the DominantColors of your new image? (Note: DominantColors is listable, so you don’t have to use Map.)
◼ What if we look at more than three DominantColors: DominantColors[img,n]?
◼ Let’s try visualizing these in colorspace using ChromaticityPlot.
CHECKPOINT
Check to see if students have one or more images that they like.
Encourage students to deploy their images to the cloud for their friends to see!
◼ If time allows, students could write a function that will apply a designated color filter.
◼ If students have written a color filter function, they may want to CloudDeploy it as a FormFunction.
FINAL POINT
FINAL POINT
Ten minutes before the end of the module time.
Summarize
Summarize
Summarize what was done in the module and talk about findings.
Refer
Refer
Refer back to the learning objective and summarize how you have reached it.
Extend
Extend
Extend the module to the future. For example, "If you have time at home, try using ImageEffects to add other differences to your image (make it look like a comic book or an oil painting. and then change the color too!)."
Possible Additional Relevant Functions
ImageEffects • FormFunction • ChromaticityPlot • ColorConvert • Binarize • ColorNegate • CurrentImage • ImageData • ImageAdd
Possible Pitfalls
Possible Pitfalls
◼
If students try to use RGB values larger than 1, point out that they can use either decimals or fractions, but the numbers have to be between 0 and 1.