Humidity in the United States

A simple exploration of the relative humidity of regions within the United States.
June 23, 2017—Jackreece Ejini

Motivation

The human body is very sensitive to changes in the relative humidity of an environment. At higher humidity, there is difficulty cooling the body through sweating because the air is already saturated with water vapor, and at low humidity there is also discomfort because the air is dry and thus humans are prone to dry or broken skin and dried up mucosa. In this exploration, I try to find the ideal humidity for both indoor and outdoor environments, which US states have the highest and lowest humidities and those states within the midrange of 50 to 60 percent humidity.
The first thing to do is get a list of the states of the US so I can see what I’m going to be dealing with.
CountryData["UnitedStates","Regions"]
{Alabama,Alaska,Arizona,Arkansas,California,Colorado,Connecticut,Delaware,DistrictOfColumbia,Florida,Georgia,Hawaii,Idaho,Illinois,Indiana,Iowa,Kansas,Kentucky,Louisiana,Maine,Maryland,Massachusetts,Michigan,Minnesota,Mississippi,Missouri,Montana,Nebraska,Nevada,NewHampshire,NewJersey,NewMexico,NewYork,NorthCarolina,NorthDakota,Ohio,Oklahoma,Oregon,Pennsylvania,RhodeIsland,SouthCarolina,SouthDakota,Tennessee,Texas,Utah,Vermont,Virginia,Washington,WestVirginia,Wisconsin,Wyoming}
OK, so there it is. The next natural thing to do is check out the relative humidity of the states.
WeatherData[#,"Humidity"]&/@CountryData["UnitedStates","Regions"]
{0.764,$Failed,0.889,$Failed,0.885,0.879,$Failed,1.,$Failed,0.942,0.987,$Failed,$Failed,$Failed,1.,0.889,0.94,$Failed,0.914,0.883,0.939,$Failed,$Failed,$Failed,$Failed,$Failed,0.46,$Failed,0.964,$Failed,$Failed,$Failed,0.791,$Failed,$Failed,0.841,1.,1.,$Failed,$Failed,$Failed,$Failed,0.869,1.,$Failed,0.962,0.375,0.964,$Failed,$Failed,1.}
We can see that some of the states do not have available data, thus the $Failed tag. One point of note is that this gets relative humidity, which is a percentage, as a float. Simply multiplying by 100 and adding the percent sign would show it in percentages, but for now we need the floats because of the kinds of computations we want to do. It is also noteworthy that these values are instant values, not averages over a period of time.
Next we create some variables.
statesUS=CountryData["UnitedStates","Regions"];
humidityOfStates=WeatherData[#,"Humidity"]&/@CountryData["UnitedStates","Regions"];
Now I pair the data values and states to their relative humidity values.
statehumiditypair=Transpose[{statesUS,humidityOfStates}]
{{Alabama,0.764},{Alaska,$Failed},{Arizona,0.889},{Arkansas,$Failed},{California,0.885},{Colorado,0.879},{Connecticut,$Failed},{Delaware,1.},{DistrictOfColumbia,$Failed},{Florida,0.942},{Georgia,0.987},{Hawaii,$Failed},{Idaho,$Failed},{Illinois,$Failed},{Indiana,1.},{Iowa,0.889},{Kansas,0.94},{Kentucky,$Failed},{Louisiana,0.914},{Maine,0.883},{Maryland,0.939},{Massachusetts,$Failed},{Michigan,$Failed},{Minnesota,$Failed},{Mississippi,$Failed},{Missouri,$Failed},{Montana,0.46},{Nebraska,$Failed},{Nevada,0.964},{NewHampshire,$Failed},{NewJersey,$Failed},{NewMexico,$Failed},{NewYork,0.791},{NorthCarolina,$Failed},{NorthDakota,$Failed},{Ohio,0.841},{Oklahoma,1.},{Oregon,1.},{Pennsylvania,$Failed},{RhodeIsland,$Failed},{SouthCarolina,$Failed},{SouthDakota,$Failed},{Tennessee,0.869},{Texas,1.},{Utah,$Failed},{Vermont,0.962},{Virginia,0.375},{Washington,0.964},{WestVirginia,$Failed},{Wisconsin,$Failed},{Wyoming,1.}}
We then clean up the data, removing state-humidity pairs where there is no data for humidity, i.e where we have $Failed.
cleanedUpdata=Select[statehumiditypair,#[[2]]=!=$Failed&]
{{Alabama,0.764},{Arizona,0.889},{California,0.885},{Colorado,0.879},{Delaware,1.},{Florida,0.942},{Georgia,0.987},{Indiana,1.},{Iowa,0.889},{Kansas,0.94},{Louisiana,0.914},{Maine,0.883},{Maryland,0.939},{Montana,0.46},{Nevada,0.964},{NewYork,0.791},{Ohio,0.841},{Oklahoma,1.},{Oregon,1.},{Tennessee,0.869},{Texas,1.},{Vermont,0.962},{Virginia,0.375},{Washington,0.964},{Wyoming,1.}}
Let’s visualize this data in a PieChart.
PieChart[#[[2]]&/@cleanedUpdata,ChartLegends(#[[1]]&/@cleanedUpdata),ChartStyle"Pastel"]
Alabama
Arizona
California
Colorado
Delaware
Florida
Georgia
Indiana
Iowa
Kansas
Louisiana
Maine
Maryland
Montana
Nevada
NewYork
Ohio
Oklahoma
Oregon
Tennessee
Texas
Vermont
Virginia
Washington
Wyoming
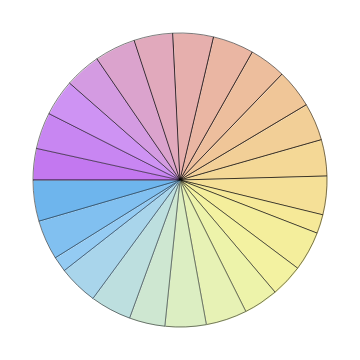
You can see that since the values are close to each other in magnitude, one cannot make out visually which states have a higher or lower relative humidity. If you touch the sections of the chart with your mouse, a tooltip pops up to show the values. I do not personally consider this chart very informative, so I will proceed with other forms of visualizing the data.
Next I obtain a list of state abbreviations.
abbr={"AL","AR","CA","CO","DE","FL","GA","IN","IO","KS",​​"LA","ME","MD","MT","NV","NY","OH","OK","OR","TN","TX",​​"VT","VA","WA","WY"};
I only got state name abbreviations for those states that have relative humidity values.
Let’s make a BarChart to see if we can get any insight.
BarChart[#[[2]]&/@cleanedUpdata,ChartLabelsPlaced[abbr,Below,Rotate[#,Pi/4]&],BarSpacingAutomatic]
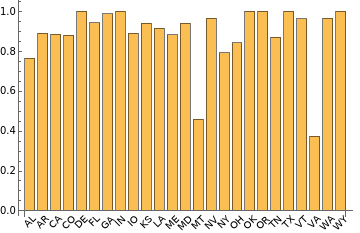
This looks cleaner, and we can see that the state of Virginia has the lowest humidity so far, followed by Montana—but it’s not really clear which state has the highest relative humidity as of the present moment.
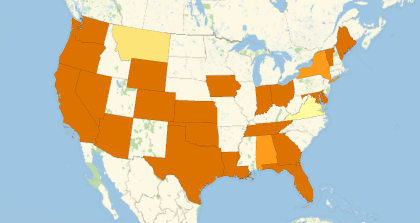
Let’s visualize this on a map of the United States to see things a little clearer.
GeoRegionValuePlot[​​Map[(Entity[​​"AdministrativeDivision",{#[[1]],"UnitedStates"}]#[[​​2]])&,cleanedUpdata]]
I would like to know which states have the highest and lowest relative humidity, so let’s try this.
SortBy[cleanedUpdata,#[[2]]&]
{{Virginia,0.375},{Montana,0.46},{Alabama,0.764},{NewYork,0.791},{Ohio,0.841},{Tennessee,0.869},{Colorado,0.879},{Maine,0.883},{California,0.885},{Arizona,0.889},{Iowa,0.889},{Louisiana,0.914},{Maryland,0.939},{Kansas,0.94},{Florida,0.942},{Vermont,0.962},{Nevada,0.964},{Washington,0.964},{Georgia,0.987},{Delaware,1.},{Indiana,1.},{Oklahoma,1.},{Oregon,1.},{Texas,1.},{Wyoming,1.}}
By eyeballing the list, we can see that the relative humidity in several states is 100 percent. Let’s try to extract them out of the main list.
Select[SortBy[cleanedUpdata,#[[2]]&],(#[[2]]1&)]
{{Delaware,1.},{Indiana,1.},{Oklahoma,1.},{Oregon,1.},{Texas,1.},{Wyoming,1.}}
And the state with the lowest relative humidity is:
SortBy[cleanedUpdata,#[[2]]&][[1]]
{Virginia,0.375}
Let’s see a line plot of the data:
ListLinePlot[#[[2]]&/@SortBy[cleanedUpdata,#[[2]]&]]
0
5
10
15
20
25
0.6
0.7
0.8
0.9
1.0
This looks a lot like a staircase!
So we now look at the states that currently have the most favorable relative humidity (within 50–60%).
I had to widen the search range because I couldn’t find cities that had “perfect” relative humidity values, but Alabama, Montana and New York had favorable relative humidity levels as of summer 2017!

Further Exploration

This exploration is more focused on the United States and deals with the current relative humidity. The data will definitely change every time the notebook is executed. Further work will be to get the relative humidity of a particular region for a period of time and run some analysis.
I would also like to see how these long-range values compare from state to state.
The next obvious step would be to take the exploration global by doing it for the whole planet. Interesting information to find would be the most humid region(s) on Earth and how this relates to precipitation.
AUTHORSHIP INFORMATION
Jackreece Ejini
6/23/17