Harnessing the IoT for Global Development

A foray into understanding how the Internet of Things could be applicable to addressing global issues.
June 24, 2017—Benjamin Keller

Introduction

The Internet of Things (IoT) has many applications in the developing world in fields such as healthcare, agriculture, resource management and water. There are many initiatives currently underway, such as monitoring vaccines in the cold chain, measuring water pump use with accelerometers, raising crop yields, networking smoke and fire detectors, tracking epidemic outbreaks and many others.

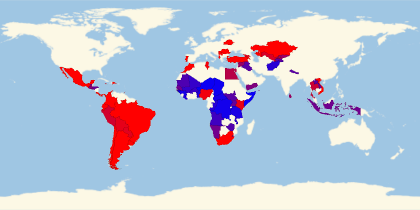
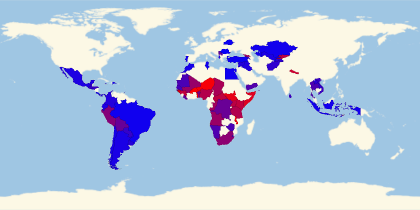
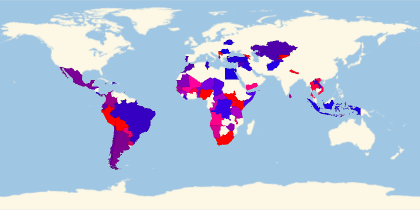
Map of Internet Access and Child Labor

First, let’s get the data from Wolfram|Alpha, using natural language input, on child labor percentages as well as Internet usage data.
Get data from Wolfram|Alpha for relevant statistics across all countries:
In[]:=
data=({#1,QuantityMagnitude[WolframAlpha[#1<>" internetusage","ComputableData"][[4]]],QuantityMagnitude[WolframAlpha[#1<>" child labor",{{"Result",1},"ComputableData"}][[1]]]}&)/@CanonicalNameEntityList
all countries, dependencies, and territories
COUNTRIES
;
Not all countries have data on both of these, so we can remove those countries and format the list.
Flatten the embedded lists and only keep ones with real values:
In[]:=
data2=Cases[Map[Flatten,data],{_,_Real,_Real}];
Now we can plot both values on their own world maps to visualize them both.
Create a geoplot with a red-blue gradient:
In[]:=
GeoRegionValuePlot[(Entity["Country",#[[1]]]RGBColor[QuantityMagnitude[#[[2]]]/50,0,1-(QuantityMagnitude[#[[2]]])/50]&)/@data2]
Out[]=
In[]:=
GeoRegionValuePlot[(Entity["Country",#[[1]]]RGBColor[QuantityMagnitude[#[[3]]]/50,0,1-(QuantityMagnitude[#[[3]]])/50]&)/@data2]
Out[]=
We can then create a world plot with a gradient based on the multiplication of Internet usage with child labor percentages.
Create an interpretative geoplot with a relationship between the two statistics:
In[]:=
GeoRegionValuePlot[(Entity["Country",#[[1]]]RGBColor[QuantityMagnitude[#[[2]]]*(QuantityMagnitude[#[[3]]])^1.5/1600,0,1-(QuantityMagnitude[#[[2]]]*QuantityMagnitude[#[[3]]])/800]&)/@data2]
Out[]=
This map can highlight countries that have great Internet access but high child labor percentages, and therefore could be good candidates for implementing IoT technology.
FURTHER EXPLORATIONS
Connected Devices
Global Development
AUTHORSHIP INFORMATION
Benjamin Keller
6/24/17