In[]:=
Sun 12 Mar 2023 13:12:43
Non-homogenous products of diagonal A and rank1 B
Non-homogenous products of diagonal A and rank1 B
Distribution of traces
Distribution of traces
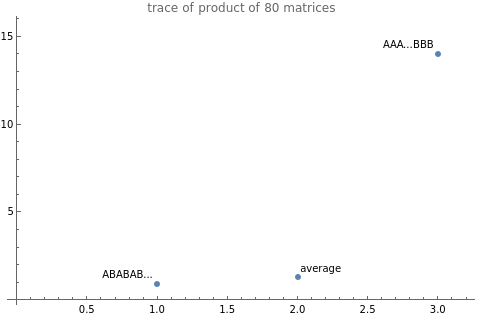
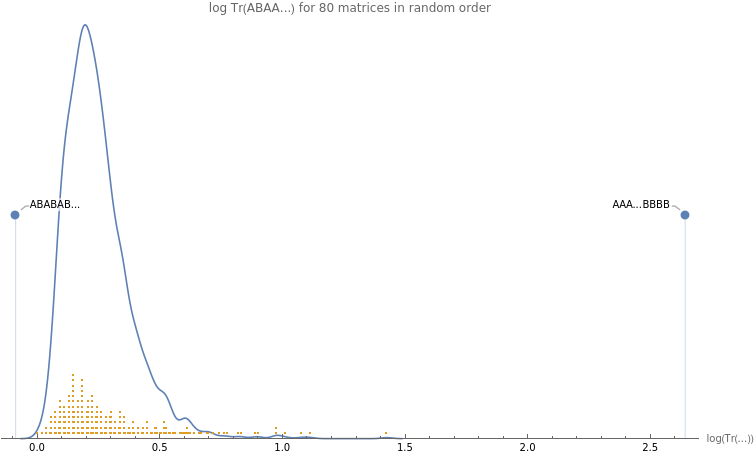
Q: what is distribution of values of terms like Tr(ABA..B) in in Tr((A+B)^s) after distributed over trace?
A: seems to concentrate around the mean as d increases , and specific orders bound average value
A: seems to concentrate around the mean as d increases , and specific orders bound average value
In[]:=
Clear[a,b,s];s0=40;as=Table[a,{s0/2}];bs=Table[b,{s0/2}];d=100;traceNormalize[h_]:=h/Total[h];h=2traceNormalize[1./Range[d]];ones=ConstantArray[1.,Length@h];α=1/Tr[h];(*diagonal+rank1,fromBordelon"Structured"paper,Eq5.*)batch=1;diagTerm=+;(*rank-1term*)rank1Term=Sqrth;{diagMat,rank1Mat}={DiagonalMatrix@diagTerm,{rank1Term}.{rank1Term}};sub={a->diagMat,b->rank1Mat};actualVal=Tr[MatrixPower[diagMat+rank1Mat,s0]];numSamples=2000;randVal:=Tr[Dot@@RandomSample[as~Join~bs]/.sub];vals=Table[randVal,{numSamples}];z=Min[vals];vals=vals/z;sortedValue=Tr[Dot@@Join[as,bs]/.sub]/z;riffledValue=Tr[Dot@@Riffle[as,bs]/.sub]/z;Print["ABABAB... : ",riffledValue];Print["avg: ",Mean[vals]];Print["AAA...BBB: ",sortedValue];SF=StringForm;ListPlot[{Labeled[riffledValue,"ABABAB..."],Labeled[Mean[vals],"average"],Labeled[sortedValue,"AAA...BBB"]},PlotLabel->SF["trace of product of `` matrices",2*s0]](*https://mathematica.stackexchange.com/questions/282236/stacked-numberlineplot*)stack=Join[Apply[Sequence]@Gather@Map[List]@#,2]&;spacings=Max[SmoothKernelDistribution[vals]["PDFValues"]]/Max[Counts@vals]/5;Show[SmoothHistogram[Log@vals],ListPlot[{Callout[{Log@riffledValue,2},"ABABAB..."],Callout[{Log@sortedValue,2},"AAA...BBBB"]},PlotRange->All,Filling->Axis],NumberLinePlot[stack@Log@vals,PlotStyle->Directive[ColorData[97]@2,AbsolutePointSize[2]],Spacings->spacings],AxesLabel->{"log(Tr(...))","density"},PlotLabel->SF["log Tr(ABAA...) for `` matrices in random order",2*s0],PlotRange->All,Axes->{True,False}]
2
(ones-αh)
2
α
batch
2
h
2
α
batch
ABABAB... : 0.914164
avg: 1.29065
AAA...BBB: 14.0134
Out[]=
Out[]=
In[]:=
Debug
Debug
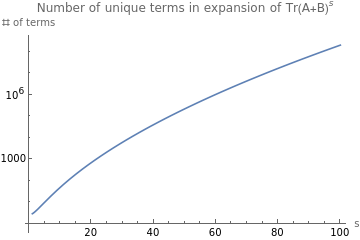
How many unique terms in Tr((A+sB))fordiagAandrank1B?
How many unique terms in
Tr((A+))fordiagAandrank1B?
s
B
Follows https://oeis.org/A052810 “1 + number of partitions of n, n>0.”
https://en.wikipedia.org/wiki/Partition_(number_theory)#Partition_function
https://en.wikipedia.org/wiki/Partition_(number_theory)#Partition_function
Out[]//TableForm=
s | # unique |
1 | 3 |
2 | 4 |
3 | 6 |
4 | 8 |
5 | 12 |
6 | 16 |
7 | 23 |
8 | 31 |
9 | 43 |
10 | 57 |
11 | 78 |
In[]:=
Table[1+Length@IntegerPartitions[k],{k,1,11}]LogPlot1+ExpPi,{n,1,100},PlotLabel->"Number of unique terms in expansion of Tr(A+B",AxesLabel->{"s","# of terms"}]
1
4n
3
2n
3
s
)\),
Out[]=
{2,3,4,6,8,12,16,23,31,43,57}
Out[]=
Using for SGD analysis (TODO: debug, should be an upper bound)
Using for SGD analysis (TODO: debug, should be an upper bound)
Q: What happens if we approximate Tr[AABBABA...] with Tr[AAA....BBBB] in Tr(A+B)^s of Bordelon Eq 5.?
A: approximation converges faster than true
A: approximation converges faster than true