In[]:=
Sun 16 Jul 2023 18:59:31
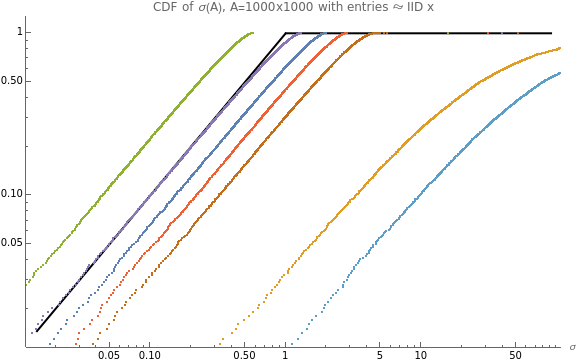
Distribution of singular values
Distribution of singular values
In[]:=
Clear["Global`*"];genCDF[coefs_]:=(z=Total[coefs];xvals=Sort@coefs;yvals=Range@Length@coefs/Length[coefs];{xvals,yvals});n=1000;dists={{"Normal",NormalDistribution[]},{"Cauchy",CauchyDistribution[]},{"Uniform",UniformDistribution[]},{"",ChiSquareDistribution[1]},{"Rayleigh",RayleighDistribution[1]},{"Lognormal",LogNormalDistribution[0,1]},{"Inverse Gamma",InverseGammaDistribution[1,2]}};SeedRandom[Method->"MKL"];valLists=SingularValueListRandomVariate[Last@#,{n,n}]
2
Chi
n
&/@dists;sf={"Log","Log"};SF=StringForm;minmax=Quantile[Flatten@valLists,#]&/@{.01,.9};legends=SF["x=``",First@#]&/@dists;refPlot=Plot[Min[x,1],{x,Sequence@@minmax},ScalingFunctions->sf,PlotStyle->{Thick,Black},PlotLegends->{"min(x,1)"}];svalPlot=ListPlot@@{genCDF[#]&/@valLists,ScalingFunctions->sf,PlotLegends->legends};Show[refPlot,svalPlot,PlotLabel->SF["CDF of σ(A), A=``x`` with entries IID x",n,n],AxesLabel->{"σ"},ImageSize->Large]Out[]=
In[]:=
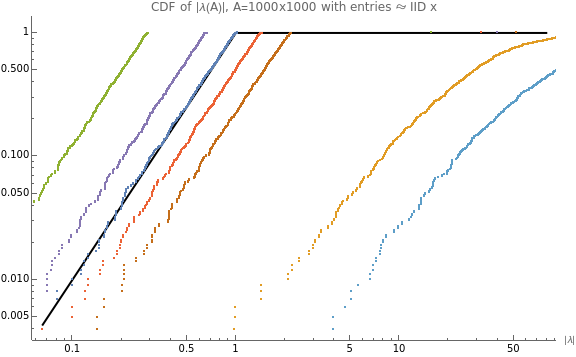
n=1000;valLists=Abs@EigenvaluesRandomVariate[Last@#,{n,n}],1],{x,Sequence@@minmax},ScalingFunctions->sf,PlotStyle->{Thick,Black},PlotLegends->{"min(,1)"}];svalPlot=ListPlot@@{genCDF[#]&/@valLists,ScalingFunctions->sf,PlotLegends->legends};Show[refPlot,svalPlot,PlotLabel->SF["CDF of |λ(A)|, A=``x`` with entries IID x",n,n],AxesLabel->{"|λ|"},ImageSize->Large]
n
&/@dists;sf={"Log","Log"};SF=StringForm;minmax=Quantile[Flatten@valLists,#]&/@{.01,.9};legends=SF["x=``",First@#]&/@dists;refPlot=Plot[Min[2
x
2
x
Out[]=
In[]:=
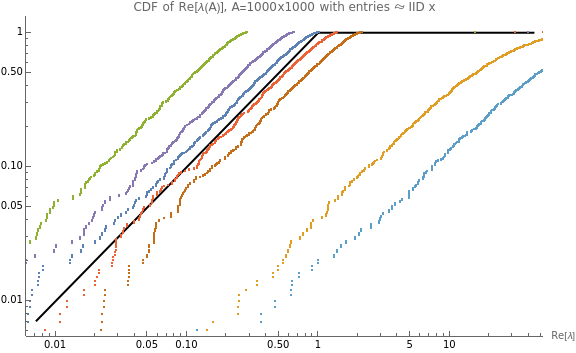
valLists=Abs@Re@EigenvaluesRandomVariate[Last@#,{n,n}]
n
&/@dists;sf={"Log","Log"};SF=StringForm;minmax=Quantile[Flatten@valLists,#]&/@{.01,.9};legends=SF["x=``",First@#]&/@dists;ref=CDF[WignerSemicircleDistribution[1],x];refPlot=Plot[Min[x,1],{x,Sequence@@minmax},ScalingFunctions->sf,PlotStyle->{Thick,Black},PlotLegends->{"min(x,1)"}];svalPlot=ListPlot@@{genCDF[#]&/@valLists,ScalingFunctions->sf,PlotLegends->legends};Show[refPlot,svalPlot,PlotLabel->SF["CDF of Re[λ(A)], A=``x`` with entries IID x",n,n],AxesLabel->{"Re[λ]"},ImageSize->Large]Out[]=
Normalized rows
Normalized rows
In[]:=
Clear["Global`*"];normRows[mat_]:=Normalize/@mat;normEigs[eigs_]:=eigs/Max[eigs];genCDF[coefs_]:=(xvals=Sort@coefs;yvals=Range@Length@coefs/Length[coefs];{xvals,yvals});n=1000;dists={{"Normal",NormalDistribution[]},{"Cauchy",CauchyDistribution[]},{"Uniform",UniformDistribution[]},{"Beta(1,1/2)",BetaDistribution[1,1/2]},{"",ChiSquareDistribution[1]},{"Rayleigh",RayleighDistribution[1]},{"Lognormal",LogNormalDistribution[0,1]},{"Inverse Gamma",InverseGammaDistribution[1,2]}};SeedRandom[Method->"MKL"];valLists=SingularValueListnormEigs@normRows@RandomVariate[Last@#,{n,n}]
2
Chi
n
&/@dists;sf={"Log","Log"};SF=StringForm;minmax=Quantile[Flatten@valLists,#]&/@{.01,.9};legends=SF["x=``",First@#]&/@dists;refPlot=Plot[Min[x,1],{x,Sequence@@minmax},ScalingFunctions->sf,PlotStyle->{Thick,Black},PlotLegends->{"min(x,1)"}];svalPlot=ListLinePlot@@{genCDF[#]&/@valLists,ScalingFunctions->sf,PlotLegends->legends};Show[refPlot,svalPlot,PlotLabel->SF["CDF of σ(A), A=``x`` with entries IID x",n,n],AxesLabel->{"σ"}]