In[]:=
Sat 6 May 2023 15:45:39
Three different spectra generated to match given rho, d constraints.Power spectrum, Posts:- Bounds on max_i p_i in terms of sum_i math.se postNotebook:- forum-mean-time-to-collision.nb: using these for non-uniform “time until collision”
||.minimizer,
||
∞
||.maximizer
||
∞
2
p_i
In[]:=
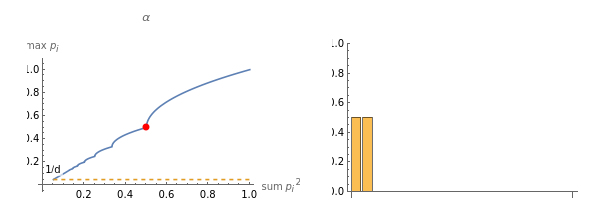
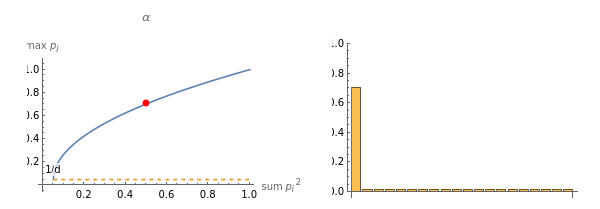
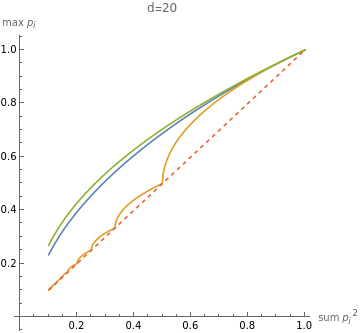
d=20;(**Seemsveryslowwhenusedinplots,needtodebugthis***)(*givenρ(sameas||p)between1/dand1,producematchingnormalizedspectruminddimensions*)powerSpectrum[rho_,d_]:=Module{h,R,dd,decay},Assertrho>=,"impossible rho setting, too small";Assert[rho<=1.,"impossible rho setting, too large"];R=;decay=IfR<1.001,100.,dd/.FindRoot==R,{dd,2,0,100};h=Table[,{i,1,d}];hTotal[h];(*valuesfromhttps://math.stackexchange.com/a/4635453/998*)linfMinHelper[rho_,d_]:=Module{m,alpha,beta,midterm,minimizer,maximizer},m=Floor+1;alpha=+;beta=+--,{d-1};{minimizer,maximizer};linfMin[rho_,d_]:=First[linfMinHelper[rho,d]];linfMax[rho_,d_]:=Last[linfMinHelper[rho,d]];(*GeneratespectrumwithgivenR,dthatminimizeormaximizestablestepsize*)generateLinfMinSpectrum[R_,d_]:=linfMin[1/R,d];generateLinfMaxSpectrum[R_,d_]:=linfMax[1/R,d];annotatedPlot[rho0_,generator_,plotLabel_]:=Plot{Max[generator[rho,d]],Labeled[1/d,"1/d",Left]},rho,,1,AxesLabel->{"sum ","max "},PlotLabel->StringForm[plotLabel],AxesOrigin->{0,0},PlotStyle->{Automatic,Dashed},Epilog->{PointSize[Large],Red,Point[{rho0,Max[generator[rho0,d]]}]};annotatedDistPlot[s0_,generator_]:=(BarChart[generator[s0,d],PlotRange->{0,1}]);annotatedCombinedPlot[s0_,generator_,label_]:=GraphicsRow[{annotatedPlot[s0,generator,label],annotatedDistPlot[s0,generator]}]With[{s0=0.5},annotatedCombinedPlot[s0,linfMin,"α"]]With[{s0=0.5},annotatedCombinedPlot[s0,linfMax,"α"]]d=20;SF=StringForm;Plot[{Max@powerSpectrum[rho,d],Max@linfMin[rho,d],Max@linfMax[rho,d],rho},{rho,2/d,1},PlotLegends->{"power-law","min ||p","max ||p"},AxesLabel->{"sum ","max "},PlotLabel->SF["d=``",d],AspectRatio->1,PlotStyle->{Automatic,Automatic,Automatic,Dashed},AxesOrigin->{0,0}]
2
||
1
d
1
rho
2
HarmonicNumber[d,dd]
HarmonicNumber[d,2dd]
-decay
i
1
rho
1
m
1
m
mrho-1
m-1
1
d
rho--+
;midterm=rho
d
1
d
1
2
d
1
m
rho--+
;minimizer=Table[alpha,{m-1}]~Join~{midterm}~Join~Table[0,{d-m}];maximizer={beta}~Join~Tablerho
m
1
m
1
2
m
1
d
1
d
drho-1
d-1
1
d
2
p
i
p
i
||
∞
||
∞
2
p
i
p
i
Out[]=
Out[]=
Out[]=
plots1=Table[annotatedCombinedPlot[s0,linfMin,"α"],{s0,1/d,1,1/d}];plots2=Table[annotatedCombinedPlot[s0,linfMax,"β"],{s0,1/d,1,1/d}];