In[]:=
deploy
Wed 10 Aug 2022 11:04:32
In[]:=
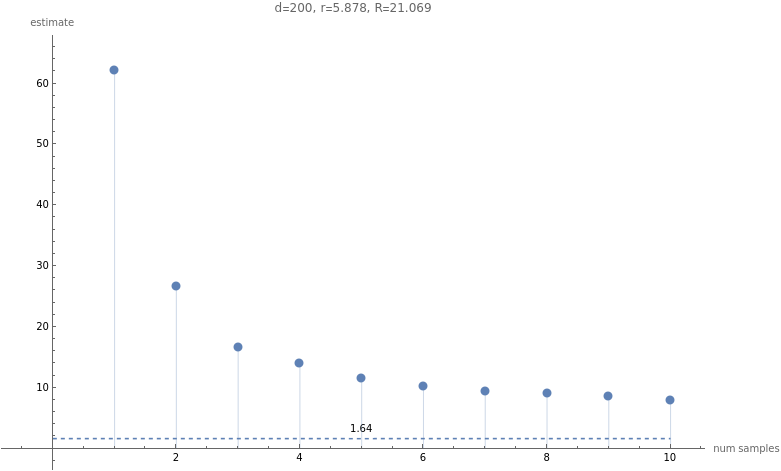
decay=1.;d=200;evals=Table[,{i,1,d}];mean=ConstantArray[0.1,d];sigma=DiagonalMatrix@evals;dist=MultinormalDistribution[mean,sigma];frobEst[samples_]:=Ex1=Norm[Mean[samples]];Ex2=Mean[&/@samples];Ex4=Mean[&/@samples];(*estimateofTrTr()*);0.5(Ex4-+2);estimateR1[X_]:=With{sigma=X.X},;estimateR2[X_]:=With{sigma=X.X},;R1=;R2=;numSamples=100;maxBatch=10;meanFrobEst[k_]:=Mean[Table[frobEst[RandomVariate[dist,k]],{numSamples}]];batchSizes=First/@Partition[Range[maxBatch],Max[1,Floor[maxBatch/10]]];estimates=Table[frobEst[RandomVariate[dist,k]],{k,batchSizes}];estimates=Table[meanFrobEst[k],{k,batchSizes}];plot1=ListPlot[estimates,Filling->Axis,PlotLegends->{"estimate"},PlotRange->All];plot2=Plot[Labeled[,NumberForm[,3],Above],{x,0,maxBatch},PlotStyle->Dashed,PlotLegends->{"true value"},PlotLabel->StringForm["d=``, r=``, R=``",d,NumberForm[R1,5],NumberForm[R2,5]],AxesLabel->{"num samples","estimate"}];Show[plot2,plot1,PlotRange->All]
-decay
i
2
Norm[#]
4
Norm[#]
2
(sigma)
2
sigma
2
Ex2
4
Ex1
2
Norm[X,"Frobenius"]
Norm[sigma]
2
2
Norm[X,"Frobenius"]
Norm[sigma,"Frobenius"]
Tr[sigma]
Norm[sigma]
2
Tr[sigma]
Norm[sigma,"Frobenius"]
2
Norm[sigma,"Frobenius"]
2
Norm[sigma,"Frobenius"]
Out[]=