In[]:=
deploy
Sat 29 May 2021 20:46:14
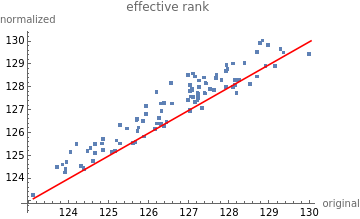
(*normalizematrixsothatithas1'sondiagonal*)normalizeDiag[mat_]:=Module[{},factors=DiagonalMatrix[1/Diagonal@mat];Sqrt[factors].mat.Sqrt[factors]];(*normalizematrixtohavetrace1*)traceNormalize[mat_]:=mat/Tr[mat];n=500;nMats=100;randMat:=RandomVariate[NormalDistribution[],{n,n}];randCov:=With[{m=RandomVariate[NormalDistribution[],{n,n}]},m.m];A=randMat;mat=A.Transpose[A];rank[m_]:=;data={rank[#],rank[normalizeDiag[#]]}&/@Table[randCov,nMats];plot1=ListPlot[data,AxesLabel{"original","normalized"},PlotLabel"effective rank"];plot2=Plot[x,{x,Min[data],Max[data]},PlotStyleRed];Show[plot1,plot2]
Tr[m]
Norm[m]
Out[]=
In[]:=
(*createsomeill-conditionedmatrices*)(*returnrandomrotation/reflection*)randomRotation[n_]:=Module[{M,z,q,r,d,ph},z=RandomVariate[NormalDistribution[0,1],{n,n}];{q,r}=QRDecomposition[z];d=Diagonal[r];ph=d/Abs[d];M=q*ph];n=300;hess=DiagonalMatrix[Table[1/i,{i,1,n}]];eigs=Table[Eigenvalues[rot=randomRotation[n];normalizeDiag[rot.hess.rot]],{200}];plot1=ListPlot[Total[#]/Max[#]&/@eigs];plot2=Plot[Total[Diagonal@hess],{x,0,Length[eigs]},PlotStyleRed];Show[plot1,plot2,PlotRangeAll]
Out[]=
Measure effect on trace-normalized matrices
Measure effect on trace-normalized matrices
In[]:=
n=500;hess=DiagonalMatrix[Table[1./i,{i,1,n}]];hess=n*traceNormalize[hess];eigs=Table[Eigenvalues[rot=randomRotation[n];normalizeDiag[rot.hess.rot]],{200}];plot1=ListPlot[Max[#]&/@eigs];plot2=Plot[Max@hess,{x,0,Length[eigs]},PlotStyleRed];Show[plot1,plot2,PlotRangeAll]
Out[]=