In[]:=
Tue 5 Dec 2023 17:02:24
Convergence of Gaussian SGD in high dimension
Convergence of Gaussian SGD in high dimension
Code
Code
In[]:=
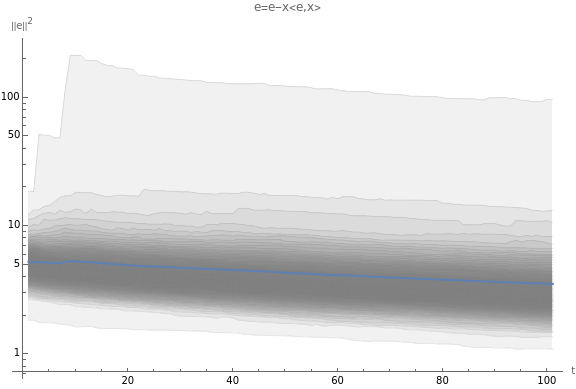
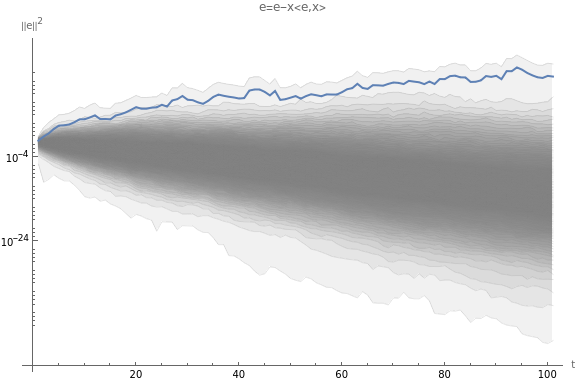
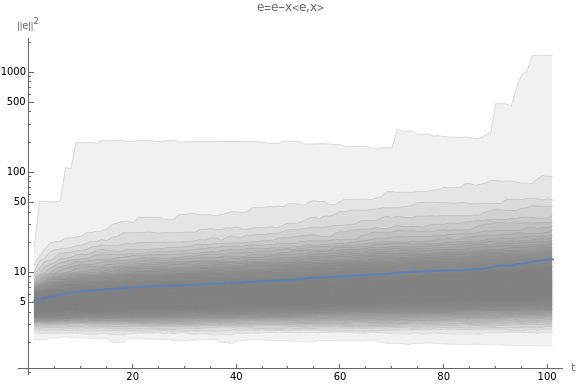
Clear["Global`*"];(* ,,...,, by using step size a *) generatePlot[p_,d_,a_]:=Module[{},B=1000;numSteps=100;ones=ConstantArray[1.,d];h=Table[,{i,1,d}];sampler=gaussianSampler[h];W0=sampler[B];step[w_,x_]=w-a x x.w;batchStep[W_]:=MapThread[step,{W,sampler[B]}];traj=NestList[batchStep,W0,numSteps]; (* numSteps x B x d *)errorNorms2=Total[traj*traj,{3}]; (* numSteps x B *)numQuantiles=100;compress[l_]:=Quantile[l,#]&/@Range[0,1,1/numQuantiles];meanPlot=ListLinePlot[Total[errorNorms2,{2}]/B,ScalingFunctions->"Log",PlotLegends->{"mean"}];filling=Table[i->{numQuantiles+2-i},{i,1,numQuantiles/2}];distPlot=ListLinePlot[Transpose[compress/@errorNorms2],ScalingFunctions->"Log",Filling->filling,FillingStyle->Directive[Opacity[.1],EdgeForm[]],PlotStyle->{Directive[Gray,Thin]}];Show[distPlot,meanPlot,AxesLabel->{"t","||e"},PlotLabel->SF["e=e-x<e,x>",d],ImageSize->Large]];
https://math.stackexchange.com/questions/4519054/bounds-on-spectral-radius-of-2-textdiaghh-cdot-1t
*)stepL2SGDfast[h_]:=Module[{d=Length[h],normalize,step,evec},normalize[v_]:=v/Sqrt@Total[v*v];step[v_]:=2h*v+h*Total[v];evec=FixedPoint[normalize[step[#]]&,ConstantArray[1.,d],1000];2/Norm[step@evec]](* Gaussian sampler with diagonal covariance *)SeedRandom[1,Method->"MKL"];SF=StringForm;gaussianSampler[diag_]:=With{d=Length[diag]},Compile{{n,_Integer}},Module{vals,diagSqrt},diagSqrt=diag
;vals=diagSqrt*#&/@RandomVariate[NormalDistribution[],{n,d}];(* Generates plot for Gaussian SGD with cov eigenvalues -p
1
-p
2
-p
d
-p
i
2
||
Visualization
Visualization
d=1
d=1
In[]:=
p=1;d=1;(*1Ddivergencethreshold,seeDSP.se
post
*)a=2.421249521036836042992780131428225933128842834067867847377838424345397835692066559296652232682365322;generatePlot[p,d,a*.8]Out[]=
d=100
d=100
In[]:=
a
Out[]=
0.336923
In[]:=
SeedRandom[1];p=1;d=100;a=stepL2SGDfast[Table[,{i,1,d}]];plot1=generatePlot[p,d,a*1.1];plot1meanErrors1={First[#],Last[#]}&@(Mean/@errorNorms2);plot2=generatePlot[p,d,a*0.9]meanErrors2={First[#],Last[#]}&@(Mean/@errorNorms2);SF=StringForm;SF["a=``",N[a,10]]TableForm[{meanErrors1,meanErrors2},TableHeadings->{{"a*1.1","a*.9"},{"first","last"}}]
-p
i
Out[]=
Out[]=