In[]:=
Wed 25 Dec 2024 16:45:00
Original question 24dec24
Original question 24dec24
Out[]//TableForm=
s=1 | 367.000 | 368.000 |
s=2 | 270.000 | 270.000 |
s=3 | 224.000 | 224.000 |
s=4 | 195.000 | 195.000 |
s=5 | 175.000 | 175.000 |
Normality check
Normality check
Deviation from normality: 0.52173
Longer simulation
Longer simulation
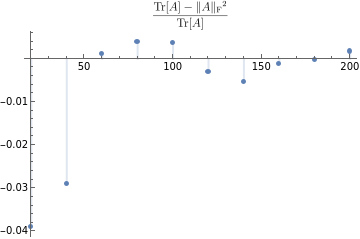
Resticted to trace vs Frob norm 25dec24
Resticted to trace vs Frob norm 25dec24
25dec25
Out[]=
Out[]//TableForm=
d=20 | 0.3635 | 0.3672 | 0.3585 |
d=60 | 0.3672 | 0.3672 | 0.3648 |
d=100 | 0.3637 | 0.3639 | 0.3660 |
d=140 | 0.3676 | 0.3703 | 0.3666 |
d=180 | 0.3683 | 0.3693 | 0.3669 |
d=220 | 0.3678 | 0.3676 | 0.3670 |
d=260 | 0.3679 | 0.3675 | 0.3672 |
d=300 | 0.3677 | 0.3676 | 0.3673 |
d=340 | 0.3687 | 0.3684 | 0.3673 |
d=380 | 0.3689 | 0.3682 | 0.3674 |

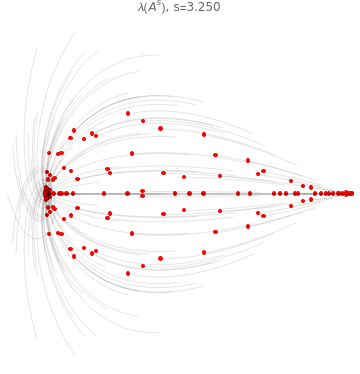
Animate eigenvalues
Animate eigenvalues
In[]:=
makeOperator[d0_]:=(d=d0;m=d;ii=IdentityMatrix[d];A=RandomVariate[NormalDistribution[],{m,d}];A=Normalize/@A;T=Fold[Function[{W,x},Table[w-x(w.x),{w,W}]],ii,A];evals=Eigenvalues[T];svals=SingularValueList[T];);Needs["MaTeX`"];spectralMoment[s_]:=Total[]/d;singularMoment[s_]:=Total[]/d;ff[k_]:=MaTeX[HoldForm[k]];SetAttributes[ff,HoldAll];makeOperator[100];Plot[{Total@Re[],Total[]},{s,1,10},AxesLabel->{"s"},PlotLegends->{ff[Sum[,i]],ff[Sum[,i]]},PlotLabel->"Sums of powers of eigenvalues and singular values of A"]makeOperator[20];plot1=Plot[Re[],{s,1,10},PlotStyle->Directive[Opacity[.5],Blue],PlotLegends->{ff[Re[]]}];plot2=Plot[,{s,1,10},PlotStyle->Directive[Opacity[.5],Red,Dashed],PlotLegends->{ff[]}];Show[plot1,plot2,AxesLabel->{"s"},PlotLabel->"Powers of eigenvalues and singular values of A"]
s
evals
2s
svals
s
evals
2s
svals
s
λ
i
2s
σ
i
s
evals
s
λ
2s
svals
2s
σ
Out[]=