In[]:=
Wed 17 Jan 2024 18:16:36
In[]:=
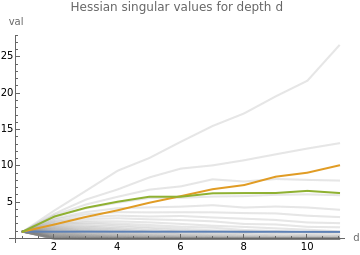
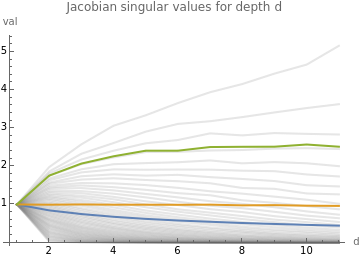
takeEvenly[vals_,numClusters_]:=Module[{cdfPoints,indices},(*Drop1,thelastendpoint*)cdfPoints=Most@Subdivide[0,1,numClusters];indices=Floor[Length[vals]*cdfPoints]+1;vals[[indices]]];takeX[vals_]:=takeEvenly[vals,55];w=400;d=10;pad[l_]:=PadRight[l,w];SeedRandom[1,Method->"MKL"];rand:=RandomVariate[NormalDistribution[],{w,w}]]&/@lists,Quantile[#,.95]&/@lists},PlotLegends->{"mean","","5% quantile"}];mainPlot=ListLinePlot[takeX@Transpose[lists],PlotRange->All,PlotStyle->Directive[Opacity[.2],Gray],PlotLegends->{"singular value"}];Show[mainPlot,auxPlot,AxesLabel->{"d","val"},PlotLabel->label]);averagePlot[jacSvals,"Jacobian singular values for depth d"]averagePlot[hessSvals,"Hessian singular values for depth d"]
w
;layers=Table[rand,{d}];ii=IdentityMatrix[w];jacobians=FoldList[#1.#2&,ii,layers];hessians=FoldList[#2.#1.#2&,ii,layers];jacSvals=pad[SingularValueList[#]]&/@jacobians;hessSvals=pad[SingularValueList[#]]&/@hessians;(*givenlistofevolvingquantities,plotthemandtheiraverage*)averagePlot[lists_,label_]:=(auxPlot=ListLinePlot[{Mean/@lists,Mean[2
#
2
mean
Out[]=
Out[]=