In[]:=
deploy
Tue 2 Aug 2022 20:24:16
Predicting largest usable batch size
Predicting largest usable batch size
1. Linear least squares estimation problem with data matrix X
2. Using Kaczmarz method, equivalent to SGD if rows of X are normalized to have norm 1
3. Learning rate 1 is “perfect” because for batchsize=1 it achieves zero loss (on the batch) in 1 step
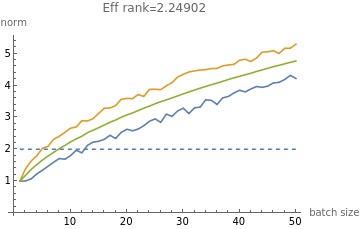
4. What’s the largest batch size b for which learning rate b is convergent for typical batch?
5. Size “b” gives critical batch size for which “linear learning rate scaling works”
6. Can we determine “b” from easily computable properties of X, like “Stable rank”?
7. For some toy problems, critical batch size b \approx = 3 * stable rank
2. Using Kaczmarz method, equivalent to SGD if rows of X are normalized to have norm 1
3. Learning rate 1 is “perfect” because for batchsize=1 it achieves zero loss (on the batch) in 1 step
4. What’s the largest batch size b for which learning rate b is convergent for typical batch?
5. Size “b” gives critical batch size for which “linear learning rate scaling works”
6. Can we determine “b” from easily computable properties of X, like “Stable rank”?
7. For some toy problems, critical batch size b \approx = 3 * stable rank
In[]:=
genPlot[evals_]:=sigma=DiagonalMatrix[evals];d=Length[evals];numSamples=10000;ii=IdentityMatrix[d];dist=MultinormalDistribution[sigma];data=RandomVariate[dist,numSamples];data=Normalize/@data;stableRank[x_]:=With{sigma=x.x},;trunc[data_]:=data[[;;Min[Length@data,100]]];maxBatch=50;maxes=Table[Max[Norm[#]&/@trunc@Partition[data,k]],{k,1,maxBatch}];mins=Table[Min[Norm[#]&/@trunc@Partition[data,k]],{k,1,maxBatch}];means=Table[Mean[Norm[#]&/@trunc@Partition[data,k]],{k,1,maxBatch}];Show[ListLinePlot[{mins,maxes,means},PlotLegends->{"smallest norm","largest norm","average norm"}],Plot[2,{x,1,maxBatch},PlotStyle->Dashed],PlotLabel->StringForm["Eff rank=``",stableRank@data],AxesLabel->{"batch size","norm"}];genPlot@Table[1./i,{i,1,10}]
Tr[sigma]
Norm[sigma]
Out[]=
In[]:=
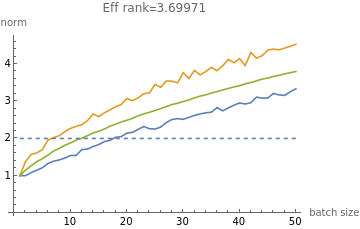
genPlot@Table[1./i,{i,1,20}]
Out[]=
In[]:=
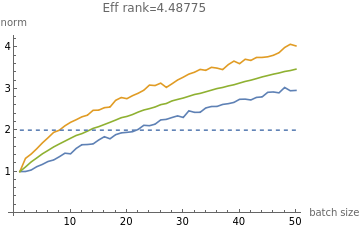
genPlotTable1.,{i,1,50}
1/2
i
Out[]=
In[]:=
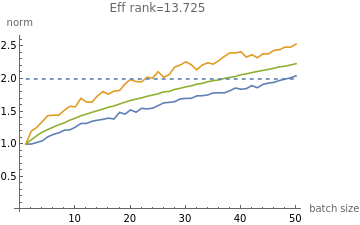
genPlotTable1.,{i,1,d}
2
i
Out[]=