In[]:=
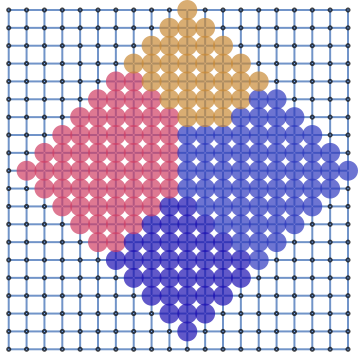
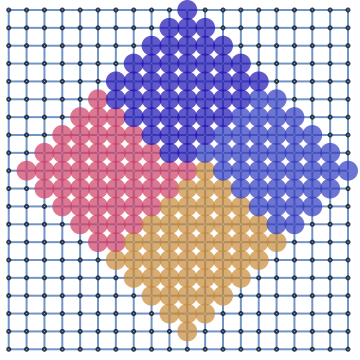
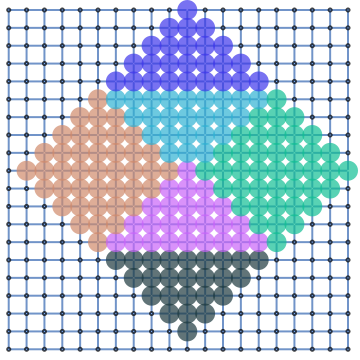
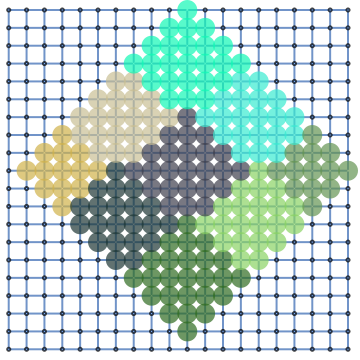
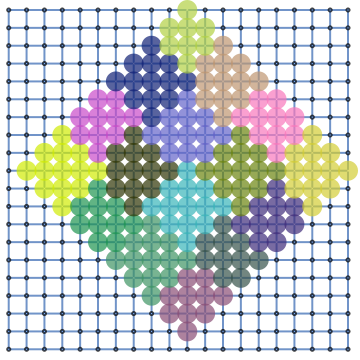
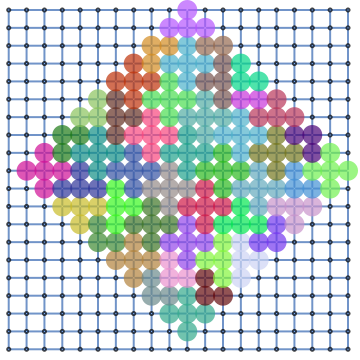
With[{graph=(SeedRandom[1];GridGraph[{20,20}])},{ambientDistances=GraphDistanceMatrix[graph],vertexIndex=AssociationThread[VertexList[graph],Range@VertexCount[graph]],center=First@FindInfraPoint[graph,"From"->"Center"],maxRadius=6},{ballGraph=Subgraph[graph,First@First@FindInfraBall[graph,center,Floor[GraphDiameter[graph]/4]]]},{colorAtRadius=radius|->With[{centers=FindBallCover[ballGraph,radius]},{centerColumns=Lookup[vertexIndex,centers],colors=(SeedRandom[1];Opacity[.7,#]&/@RandomColor[Length@centers])},Graph[graph,ImageSize->180,VertexShapeFunction->Table[v->With[{c=colors[[First@Ordering[ambientDistances[[vertexIndex[v],centerColumns]],1]]]},({c,AbsolutePointSize[10],Point[#1]}&)],{v,VertexList[ballGraph]}]]]},Row[Reverse[colorAtRadius/@Range[maxRadius]]]]
Out[]=
In[]:=
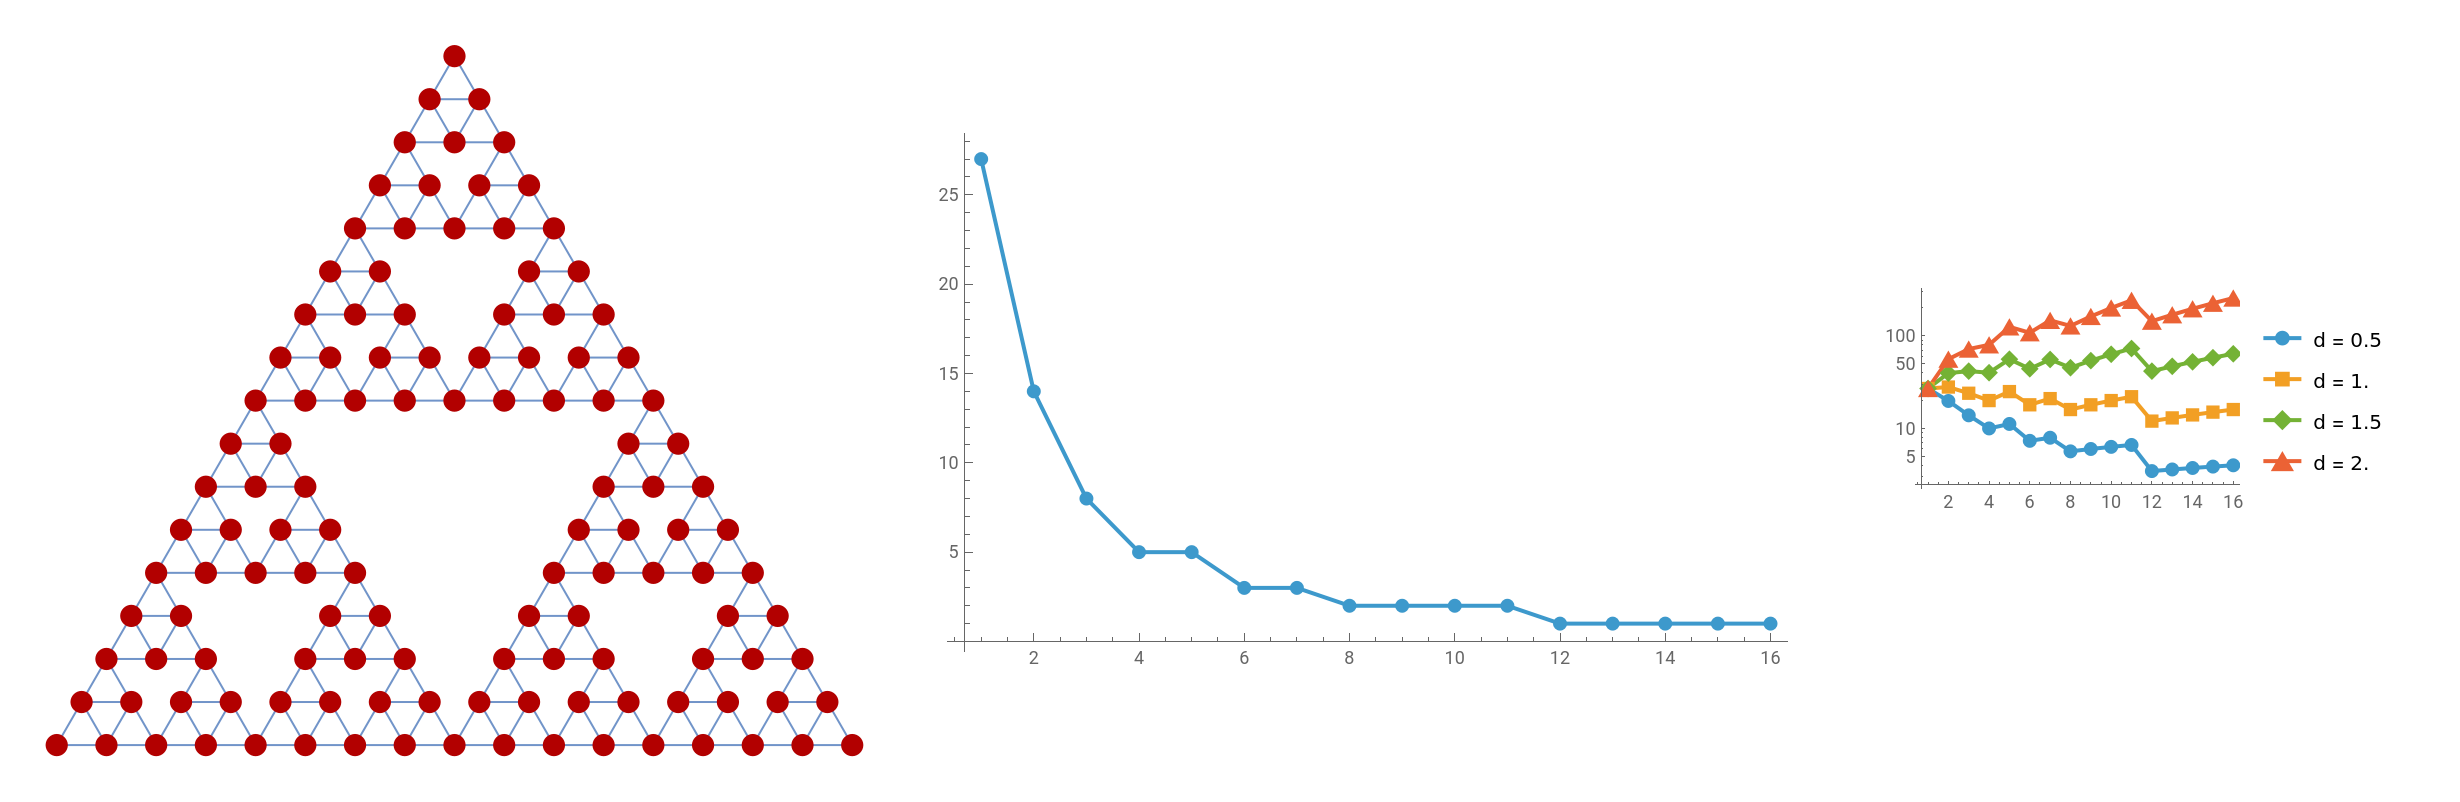
With[{g=MeshConnectivityGraph@SierpinskiMesh[4]},{center=First@GraphCenter[g]},{subset=VertexList[NeighborhoodGraph[g,center,12]]},{maxR=Max[Outer[GraphDistance[g,##]&,subset,subset,1]]},{ns=Table[Length@FindBallCover[g,r,subset],{r,maxR}]},{ds=Range[0.5,2,0.5]},GraphicsRow@{HighlightGraph[g,{subset,center}],ListLinePlot[ns,PlotMarkers->Automatic,PlotRange->All],ListLogPlot[Table[ns[[r]]*r^d,{d,ds},{r,1,maxR}],PlotLegends->("d = "<>ToString[#]&/@ds),Joined->True,PlotMarkers->Automatic,PlotRange->All]}]
Out[]=
In[]:=
With[{g=MeshConnectivityGraph@SierpinskiMesh[4]},Table[Length@FindBallCover[g,r],{r,GraphDiameter[g]}]]
Out[]=
{27,14,8,5,5,3,3,2,2,2,2,1,1,1,1,1}
In[]:=
With[{g=MeshConnectivityGraph@SierpinskiMesh[4]},ParallelTable[Length@FindBallCover[g,r],{r,GraphDiameter[g]}]]
Out[]=
{27,14,8,5,5,3,3,2,2,2,2,1,1,1,1,1}
In[]:=
With[{g=MeshConnectivityGraph@SierpinskiMesh[5]},ParallelTable[Length@FindBallCover[g,r],{r,GraphDiameter[g]}]]

Out[]=
$Aborted
In[]:=
With[{g=MeshConnectivityGraph@SierpinskiMesh[5]},ParallelTable[{r,TimeConstrained[Length@FindBallCover[g,r],5]},{r,GraphDiameter[g]}]]
Out[]=
$Aborted
In[]:=
With[{g=MeshConnectivityGraph@SierpinskiMesh[4]},ParallelTable[{r,Timing[Length@FindBallCover[g,r]]},{r,GraphDiameter[g]}]]
Out[]=
{{1,{0.255224,27}},{2,{0.636803,14}},{3,{0.030552,8}},{4,{0.018096,5}},{5,{0.325323,5}},{6,{0.02462,3}},{7,{0.03205,3}},{8,{0.032715,2}},{9,{0.03356,2}},{10,{0.036844,2}},{11,{0.036426,2}},{12,{0.035766,1}},{13,{0.034888,1}},{14,{0.031386,1}},{15,{0.02322,1}},{16,{0.017264,1}}}
In[]:=
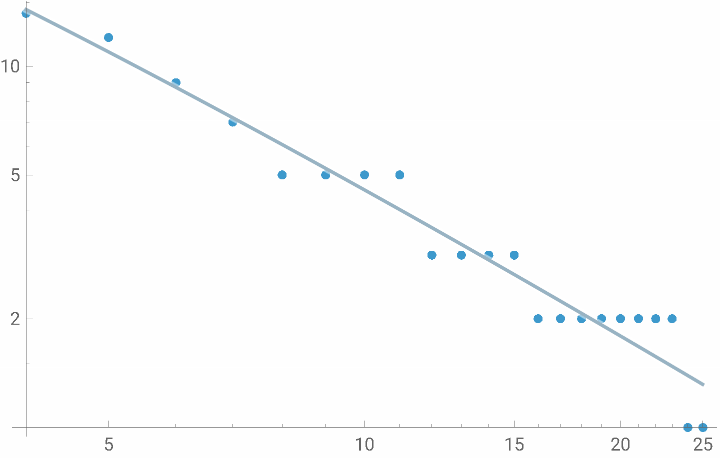
With[{g=MeshConnectivityGraph@SierpinskiMesh[5]},ParallelTable[{r,Length@FindBallCover[g,r]},{r,4,GraphDiameter[g]}]]
Out[]=
{{4,14},{5,12},{6,9},{7,7},{8,5},{9,5},{10,5},{11,5},{12,3},{13,3},{14,3},{15,3},{16,2},{17,2},{18,2},{19,2},{20,2},{21,2},{22,2},{23,2},{24,1},{25,1},{26,1},{27,1},{28,1},{29,1},{30,1},{31,1},{32,1}}
In[]:=
ModelFit,PowerModel[]
Out[]=
PowerModel
In[]:=
ModelFit[{{4,14},{5,12},{6,9},{7,7},{8,5},{9,5},{10,5},{11,5},{12,3},{13,3},{14,3},{15,3},{16,2},{17,2},{18,2},{19,2},{20,2},{21,2},{22,2},{23,2},{24,1},{25,1}},PowerModel[]]
Out[]=
PowerModel
In[]:=
ListLogLogPlot[{{4,14},{5,12},{6,9},{7,7},{8,5},{9,5},{10,5},{11,5},{12,3},{13,3},{14,3},{15,3},{16,2},{17,2},{18,2},{19,2},{20,2},{21,2},{22,2},{23,2},{24,1},{25,1}},PlotFit->PowerModel[]]
Out[]=
In[]:=
FindFit[{{4,14},{5,12},{6,9},{7,7},{8,5},{9,5},{10,5},{11,5},{12,3},{13,3},{14,3},{15,3},{16,2},{17,2},{18,2},{19,2},{20,2},{21,2},{22,2},{23,2},{24,1},{25,1}},ar^d,{a,d},r]
Out[]=
{a85.733,d-1.27739}
Graph[TwoWayRule@@@ResourceFunction["WolframModel"][{{x,y},{x,z}}->{{x,z},{x,w},{y,w},{z,w}},{{0,0},{0,0}},11,"FinalState"]]
In[]:=
HypergraphDimensionEstimateList[hg_]:=ResourceFunction["LogDifferences"][MeanAround/@Transpose[Values[ResourceFunction["HypergraphNeighborhoodVolumes"][hg,All,Automatic]]]];ListLinePlot[Select[Length[#]>3&][HypergraphDimensionEstimateList/@Drop[ResourceFunction["WolframModel"][{{x,y},{x,z}}->{{x,z},{x,w},{y,w},{z,w}},{{1,2},{1,3}},16,"StatesList"],4]],Frame->True,PlotStyle->ResourceFunction["WolframPhysicsProjectStyleData"]["GenericLinePlot","PlotStyles"]]
1172
1172
Global dimension
Global dimension