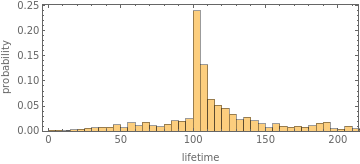
Modernized main hist
Modernized main hist
In[]:=
Module[{ru={299459058088077823758143088095350287424,4,1},init={{1},0},txspec={400,{-110,110}}},Histogram[TestCALifeTime[PerturbedCellularAutomaton[ru,init,txspec,#,"ReturnPerturbations"->False]]&/@allperts[ru,init,txspec],100,"Probability",Frame->True,AspectRatio->.4,FrameLabel->{"lifetime","probability"}]]
Out[]=
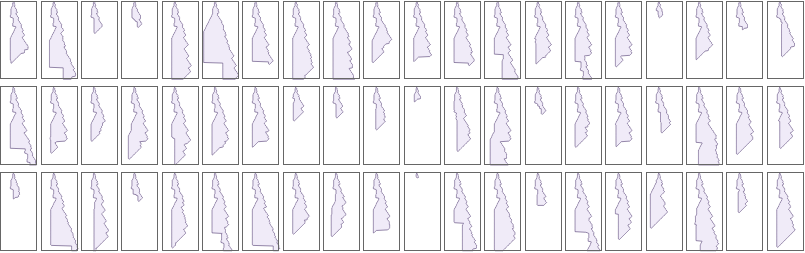
Fixed frame escapes
Fixed frame escapes
Note: for some reason same seed is giving different shapes, does SW care?
In[]:=
ps=Module[{ru={299459058088077823758143088095350287424,4,1},init={{1},0},txspec={130,{-110,110}}},SeedRandom[6353];Keys@*(RandomSample[Select[#,#==1&],60]&)@*ReverseSort@*Counts@*(CAPolygon[Take[PerturbedCellularAutomaton[ru,init,txspec,#,"ReturnPerturbations"->False],All,{90,160}]]&/@#&)@allperts[ru,init,txspec]];
In[]:=
Module{ru={299459058088077823758143088095350287424,4,1},init={{1},0}},GraphicsGrid@*(Partition[SeedRandom[6353];#,(*20*)20]&)@*GraphicsEdgeFormDarker(*AbsoluteDashing[{4,1}],*)(*AbsoluteThickness[1.25]*),FaceForm@,#,Frame->True,FrameTicks->None,PlotRange->{{3,63},{0,130}}&/@#&@ps
Out[]=
Arrow pointer first different cell
Arrow pointer first different cell
In[]:=
firststepdiffarrow[nru_]:=Module[{ru={299459058088077823758143088095350287424,4,1},init={{1},0},txspec={130,{-110,110}}(*,mca,oca,row,firstbody*)},mca=PerturbedCellularAutomaton[ru,init,txspec,<|{23,111}->2|>];oca=PerturbedCellularAutomaton[nru,init,txspec,<|{23,111}->2|>];loc=If[#=={},Return[{}],First[#]]&[SparseArray[First[mca]-First[oca]]["NonzeroPositions"]];{row,col}=loc;firstbody=nonzeroRange[First[oca][[row+1]]]//First;{Haloing[White],Red,Arrowheads[Medium],Arrow[{{34,Length[First[oca]]-row+.5},{col-100.5,Length[First[oca]]-row+.5}}]}]
In[]:=
KeyValueMap[Labeled[#1,Text[StringTemplate["(``)"][#2]]]&,ReverseSort[Counts[PlotCA[PerturbedCellularAutomaton[#,{{1},0},{130,{-110,110}},<|{23,111}->2|>],"MaxWidth"->{100,130},"Trim"->{None,None},ImageSize->{Automatic,150},"Graphics"->firststepdiffarrow[#]]&/@quickneutral[{299459058088077823758143088095350287424,4,1}]]]]
Out[]=
,
,
,
,
,
,
,
,
,
,
,
,
,
,
,
,
,
,
(16) |
(4) |
(4) |
(4) |
(4) |
(4) |
(4) |
(4) |
(4) |
(4) |
(4) |
(1) |
(1) |
(1) |
(1) |
(1) |
(1) |
(1) |
(1) |
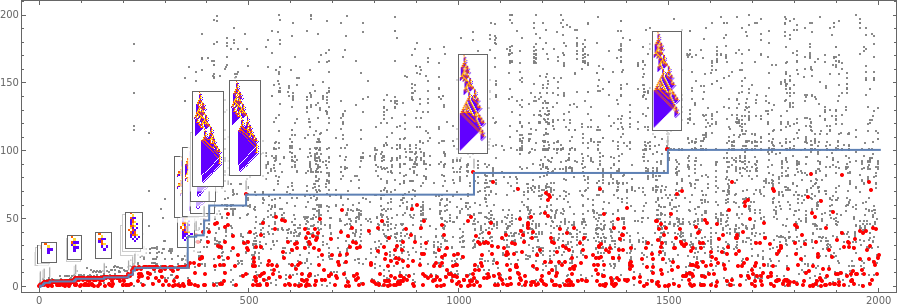
Callouts
Callouts
In[]:=
With[{},seq=ResourceFunction["ProgressiveMaxPositions"][Min/@rh[[All,3]]/.-Infinity->0];Show[ListPlot[Style[Catenate[MapIndexed[{First[#2],#1}&,rh[[All,3]],{2}]],Opacity[.7,Gray],PointSize[Small]],PlotHighlighting->None],ListPlot[Style[Catenate[MapIndexed[{First[#2],#1}&,rh[[All,3]],{2}]],Opacity[.7,Gray],PointSize[Small]],PlotHighlighting->None],ListPlot[Style[MapIndexed[If[MemberQ[seq,First[#2]],Callout[{First[#2],Min@*Last@#1},Pane[PlotCA[PerturbedCellularAutomaton[First[#],{{1},0},{200,{-50,50}},<||>],"Trim"->{1,3},ImageSize->{Automatic,10Sqrt[1+#1[[-1,1]]]}]],Above],{First[#2],Min@*Last@#1}]&,rh],PointSize[.0035],Red],PlotHighlighting->None,Filling->None,FillingStyle->LightGray,PlotRange->All],ListStepPlot[mh[[All,2]],PlotHighlighting->None],Frame->True,AspectRatio->1/3,PlotRange->All]]
Out[]=
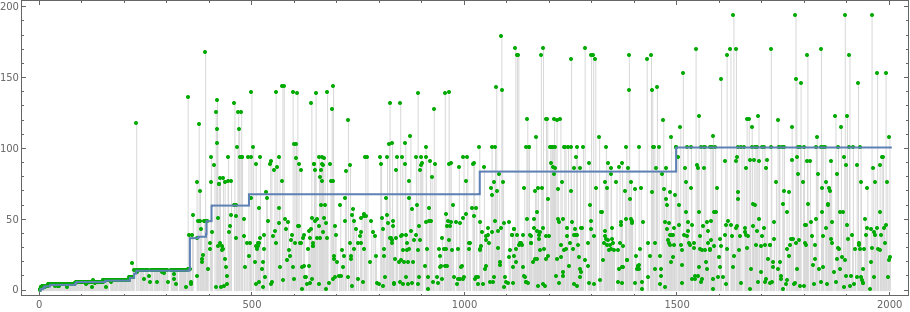
With all base cas
In[]:=
Show[ListPlot[Style[rh[[All,-1,1]],Darker[Green],PointSize[.0035]],PlotHighlighting->None,Filling->Bottom,FillingStyle->LightGray],ListStepPlot[mh[[All,2]],PlotHighlighting->None],Frame->True,AspectRatio->1/3,PlotRange->All]
Out[]=
Other options, with no red and green highlighted
In[]:=
With[{},seq=ResourceFunction["ProgressiveMaxPositions"][Min/@rh[[All,3]]/.-Infinity->0];Show[ListPlot[Style[Catenate[MapIndexed[{First[#2],#1}&,rh[[All,3]],{2}]],Opacity[.7,Gray],PointSize[Small]],PlotHighlighting->None],ListPlot[Style[Catenate[MapIndexed[{First[#2],#1}&,rh[[All,3]],{2}]],Opacity[.7,Gray],PointSize[Small]],PlotHighlighting->None],ListPlot[Style[rh[[All,-1,1]],Darker[Green,.2],PointSize[.0035]],PlotHighlighting->None(*,Filling->Bottom,FillingStyle->LightGray*)],ListPlot[Style[MapIndexed[If[MemberQ[seq,First[#2]],Callout[{First[#2],Min@*Last@#1},Pane[PlotCA[PerturbedCellularAutomaton[First[#],{{1},0},{200,{-50,50}},<||>],"Trim"->{1,3},ImageSize->{Automatic,10Sqrt[1+#1[[-1,1]]]}]],Above],{First[#2],Min@*Last@#1}]&,rh],PointSize[.0035],Red],PlotHighlighting->None,Filling->None,FillingStyle->LightGray,PlotRange->All],ListStepPlot[mh[[All,2]],PlotHighlighting->None],Frame->True,AspectRatio->1/3,PlotRange->All]]