Mean clusters
Mean clusters
Note: Repeatedly crashing my computer: SW should try
In[]:=
pcas=With[{ru={299459058088077823758143088095350287424,4,1}},PerturbedCellularAutomaton[ru,{{1},0},{120,{-30,50}},#,"ReturnPerturbations"->False]&/@allperts[CellularAutomaton[ru,{{1},0},{120,{-30,50}}]]];
In[]:=
SeedRandom[4445];out=FindClusters[PlotCA[pcas[[#]],"Trim"->{None,None}]->#&/@RandomSample[Range[Length[pcas]],3]]
Out[]=
{{3562},{4145},{1181}}
In[]:=
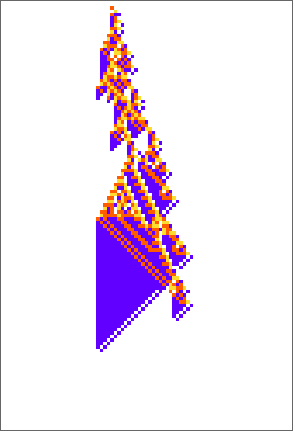
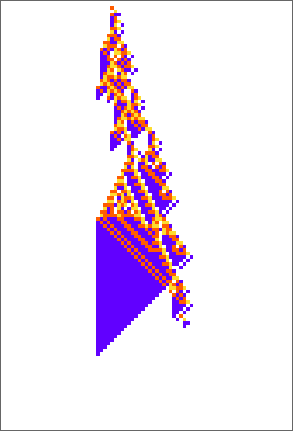
ArrayPlot[Map[Blend[Take[Last/@colorrules,4],BinCounts[#,{0,4,1}]]&,Transpose[pcas[[#]],{3,1,2}],{2}]]&/@out
Out[]=
,
,
The Effect of Genetic Diversity
The Effect of Genetic Diversity
Modernized Histogram code to run
Overall effect on lifetime:
poplts=Module[{ru={299459058088077823758143088095350287424,4,1},init={{1},0},txspec={400,{-110,110}}},SeedRandom[5555];ParallelMap[Function[rule,TestCALifeTime[PerturbedCellularAutomaton[rule,init,txspec],#]&/@allperts[rule,init,txspec]]@@#&,RandomSample[quickneutral[ru],10]]]
Histogram[#,100,"Probability",AspectRatio->.4]&/@poplts//GraphicsGrid[Partition[#,5]]&
[[[ same analyses; different genomes ]]]
[[ Therapy that works on one genome doesn’t necessarily work on others .... show all 64 cases ]]
Biological Evolution and Our Model Organism
Biological Evolution and Our Model Organism
[[ Could be whole organism, or could be e.g. an organ ]]
In[]:=
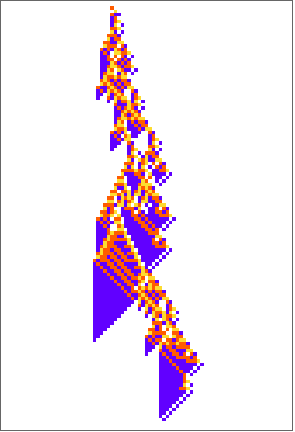
rh=Reap[mh=Module[{ru,ca,lt,lts,pcas,fitness,initru={0,4,1},initfit={0}},SeedRandom[7899623];Sow[{initru,<||>,initfit}];NestList[CompoundExpression[ru=RandomRuleMutation[First[#]],ca=CellularAutomaton[ru,{{1},0},{200,{-200,200}}];lt=TestCALifeTime[ca];If[lt==-Infinity,Sow[{ru,<||>,{lt}}];#,pcas=Table[PerturbedCellularAutomaton[ru,{{1},0},{200,{-200,200}},1],Ceiling[lt/10]];fitness=Min[lts=Join[{lt},TestCALifeTime/@(First/@pcas)]];Sow[{ru,Last/@pcas,lts}];If[fitness>=Last[#],{ru,fitness},#]]]&,{initru,First[initfit]},2000]]][[2,1]];
Out[]=
,
,
,
,
,
,
,
,
,
,
,
,
,
,
,
,
,
,
,
0 |
1 |
2 |
3 |
4 |
5 |
6 |
7 |
9 |
12 |
14 |
15 |
37 |

38 |

40 |

49 |

60 |

68 |

84 |

101 |

In[]:=
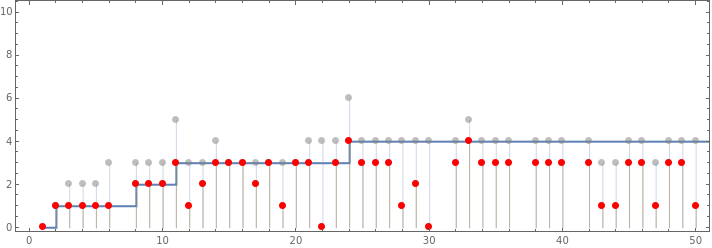
Show[ListStepPlot[mh[[All,2]]],ListPlot[Min/@rh[[All,3]],PlotHighlighting->None,PlotStyle->Red],Frame->True,AspectRatio->1/3]
Out[]=
In[]:=
Show[ListStepPlot[mh[[All,2]]],ListPlot[{Style[Catenate[MapIndexed[{First[#2],#1}&,rh[[All,3]],{2}]],Opacity[.5,Gray],PointSize[Large]],Style[MapIndexed[{First[#2],#}&,Min/@rh[[All,3]]],PointSize[Large],Red]},PlotHighlighting->None,Filling->Bottom],Frame->True,AspectRatio->1/3,PlotRange->{{0,50},{0,10}}]
Out[]=
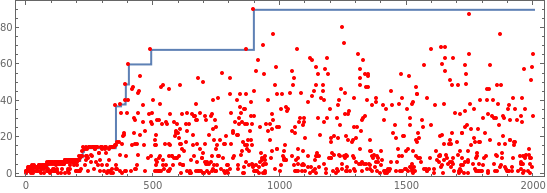
In[]:=
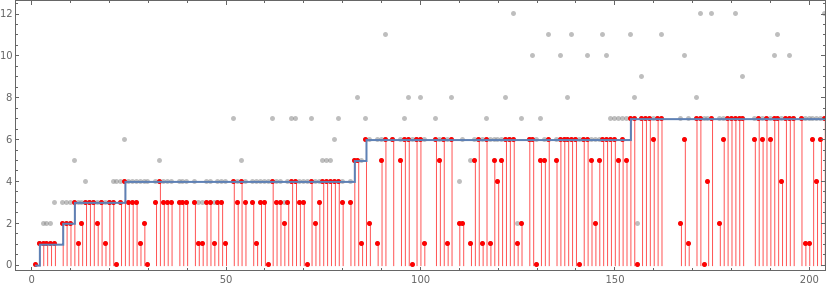
Show[ListPlot[Style[Catenate[MapIndexed[{First[#2],#1}&,rh[[All,3]],{2}]],Opacity[.5,Gray],PointSize[Medium]],PlotHighlighting->None],ListPlot[Style[MapIndexed[{First[#2],#}&,Min/@rh[[All,3]]],PointSize[Medium],Red],PlotHighlighting->None,Filling->Bottom,FillingStyle->Lighter[Red]],ListStepPlot[mh[[All,2]],PlotHighlighting->None],Frame->True,AspectRatio->1/3,PlotRange->{{0,200},{0,12}}]
Out[]=
TODO: Run this for 400
In[]:=
allpertscands=Module[{init={{1},0},txspec={200,{-110,110}}},Map[Function[rule,allperts[rule,init,txspec]],cands]];
In[]:=
ltscands=Module[{init={{1},0},txspec={200,{-110,110}}},ParallelMap[Function[{rule,aps},TestCALifeTime[PerturbedCellularAutomaton[rule,init,txspec,#,"ReturnPerturbations"->False]]&/@aps]@@#&,Transpose[{cands,allpertscands}]]];
In[]:=
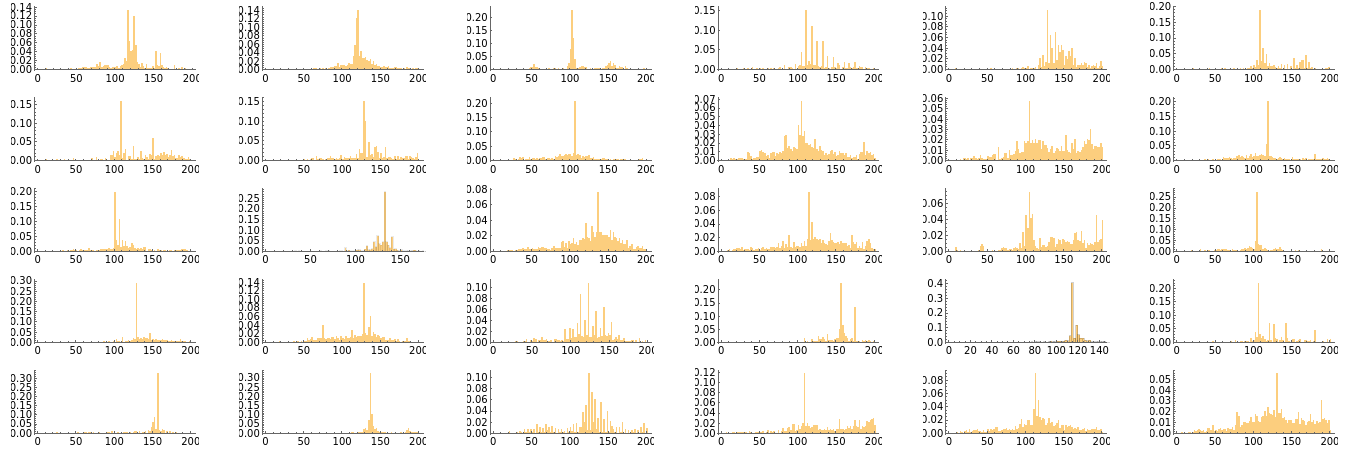
Histogram[#,100,"Probability",AspectRatio->.4]&/@ltscands//GraphicsGrid[Partition[#,6]]&
Out[]=
More honest therapy sensitivity
More honest therapy sensitivity
Clinical Trial Include?
Clinical Trial Include?