In[]:=
PlotCA[{299459058088077823758143088095350287424,4,1},"Trim"->{None,None},ImageSize->{Automatic,400}]
Out[]=
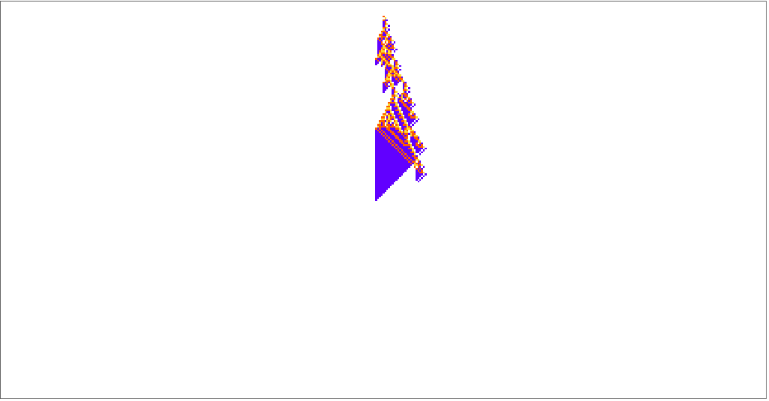
Out[]=
In[]:=
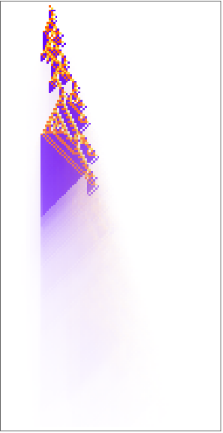
Dimensions[%]
Out[]=
{201,401}
In[]:=
tpcas=Take[Transpose[pcas,{3,1,2}],All,{180,280}];
In[]:=
Dimensions[%]
Out[]=
{201,101,4383}
In[]:=
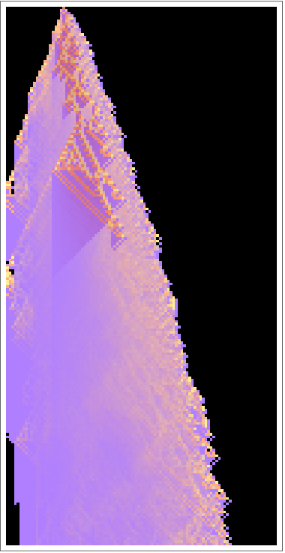
btpcas=MapBlend,,,,BinCounts[#,{0,4,1}]&,tpcas,{2};
In[]:=
ArrayPlot[%]
Out[]=
{0,1,0,0}
{.5,.6,.8,1}
MapThread[]
In[]:=
With{cc=Take[getca[{299459058088077823758143088095350287424,4,1}],All,{180,280}]},MapThreadBlend,,,,Abs[BinCounts[#,{0,4,1}]/4383-UnitVector[4,#2+1]]&,{tpcas,cc},2;
In[]:=
ArrayPlot[%]
Out[]=
In[]:=
With[{cc=Take[getca[{299459058088077823758143088095350287424,4,1}],All,{180,280}]},MapThread[Mean[Sign[#]]-Sign[#2]&,{tpcas,cc},2]];
In[]:=
MinMax[%310]
Out[]=
-,
2047
4383
228
487
Rescale[]
In[]:=
N[%]
Out[]=
{-0.467032,0.468172}
In[]:=
ColorData["LightTemperatureMap"][.3]
Out[]=
In[]:=
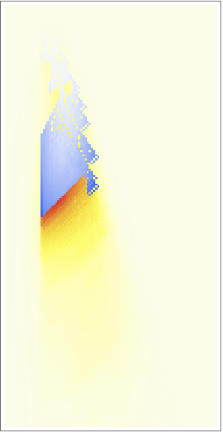
ArrayPlot,ColorFunctionScaling->False,ColorFunction->(ColorData["TemperatureMap"][Rescale[#,{-.5,.5}]]&)
Out[]=
ArrayPlot[%]
In[]:=
Median[lts/.-Infinity->1000]
Out[]=
106
In[]:=
Median[lts/.-Infinity->200]
Out[]=
106
In[]:=
Length[pcas]
Out[]=
4383
In[]:=
Length[lts]
Long Lived
Long Lived
Position[
Longer-Lived Examples
Longer-Lived Examples
Multiple Perturbations
Multiple Perturbations
Disease Features
Disease Features
New Format
New Format
Multiple Perturbations / Long Life
Multiple Perturbations / Long Life
Reformatting
Reformatting
Utilities
Utilities
Large Width
Large Width
Look for larger growth cases
Look for larger growth cases
[ give incidence rate ]
[ give incidence rate ]