In[]:=
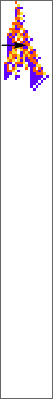
Table[Labeled[PlotCA[With[{ru={299459058088077823758143088095350287424,4,1}},SeedRandom[424324+i];PerturbCA[{getca[ru,150],ru},"NRandom"->1]],ImageSize->{Automatic,400}],i],{i,40}]
Out[]=
,
,
,
,
,
,
,
,
,
,
,
,
,
,
,
,
,
,
,
,
,
,
,
,
,
,
,
,
,
,
,
,
,
,
,
,
,
,
,
1 |
2 |

3 |
4 |

5 |

6 |

7 |

8 |

9 |
10 |

11 |

12 |

13 |

14 |

15 |
16 |

17 |
18 |

19 |

20 |

21 |

22 |

23 |
24 |

25 |

26 |

27 |
28 |

29 |

30 |

31 |

32 |

33 |

34 |

35 |

36 |

37 |

38 |

39 |

40 |

In[]:=
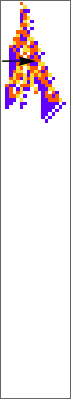
Table[Labeled[PlotCA[With[{ru={299459058088077823758143088095350287424,4,1}},SeedRandom[424324+i];PerturbCA[{getca[ru,110],ru},"NRandom"->1]],ImageSize->{Automatic,400}],i],{i,40}]
Out[]=
,
,
,
,
,
,
,
,
,
,
,
,
,
,
,
,
,
,
,
,
,
,
,
,
,
,
,
,
,
,
,
,
,
,
,
,
,
,
,
1 |

2 |

3 |
4 |

5 |

6 |

7 |

8 |

9 |
10 |

11 |

12 |

13 |

14 |

15 |

16 |

17 |

18 |

19 |

20 |

21 |

22 |

23 |

24 |

25 |

26 |

27 |

28 |

29 |

30 |

31 |

32 |

33 |

34 |

35 |

36 |

37 |

38 |

39 |

40 |

Symptoms
Symptoms
To do
To do
Enumerate all possible perturbations to our “standard example”
Enumerate all possible perturbations to our “standard example”
Classify these.... Case 1: FeatureSpacePlot; Case 2: various “symptom” feature detectors
Lifetime distribution for all perturbations
Symptoms
Symptoms
Total height ; total width
Width at a certain time step
Have perturbations only before time step 30. Then plot width at step 35 (say) vs. lifetime
All Possible Diseases
All Possible Diseases
It’s a different perturbation, so there can never be duplicates:
If width at sampled step is large, will probably have large lifetime
[[[ Not accounting for “excess growth” etc. ]]]
[[[ some of these are tumors ]]
Treatment
Treatment
Can we extend the lifespan of a short-lived case?
For a given short lifetime case, try all possible future perturbations; which ones have a good effect?
We only detected at 30 ....
Genetic Diversity
Genetic Diversity